Diversification is one of the main reasons investors use commodities in their portfolios. Despite the fact that in only 4 years since 1970 did commodities and equities drop in the same year (1981, 2001, 2008, 2011), investors lost confidence in commodities as a diversifier as the correlation spiked with equities after the crisis. That confidence is starting to return as investors watch the correlation fall into negative territory, even lower than the historical averages of 0.20 for the DJCI and 0.17 for the S&P GSCI when measured with S&P 500.
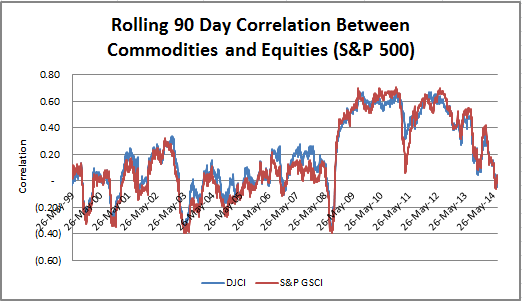
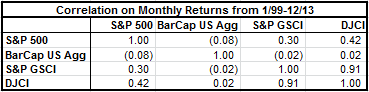
To help understand the diversification benefits from each the DJCI and S&P GSCI, we will continue our series called “Weighing In:” As you can see from the chart above, the answer to the question of “which commodity index to pick?” from correlation as a measure of diversification is not definitive. Looking at a correlation matrix like the one below based on monthly data going back to Jan 1999, the S&P GSCI fares slightly better than the DJCI with correlation of 0.30 versus 0.42.
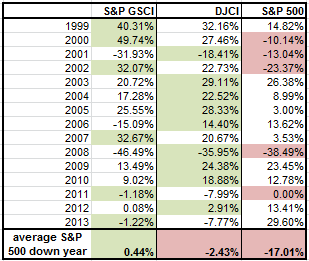
Another way some investors might describe diversification is by preservation of capital, perhaps through protection against losses from equities. When evaluating returns on an annual basis, again going back to 1999 (starting in Jan,) on average when the S&P 500 lost, it lost 17.01%. Commodities have had better performance in those years where on average the DJCI lost only 2.43% and the S&P GSCI actually showed gains, although small, of 0.44%.
With all of these measures, the S&P GSCI is showing a slightly stronger diversification benefit than the DJCI. Although, when we look at what may be the holy grail of diversification, measured by the risk adjusted return of a portfolio when commodities are added to stocks and bonds, the DJCI comes out slightly ahead.
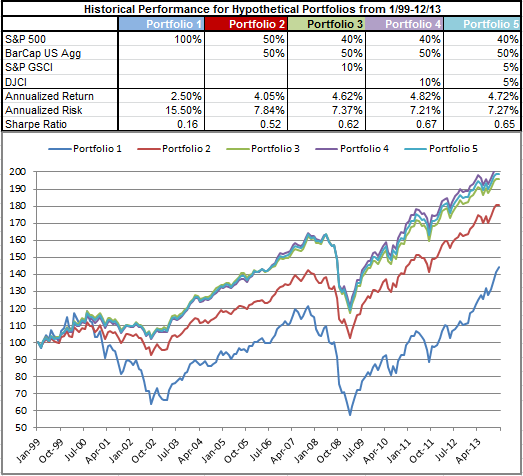
It seems, whether you pick DJCI or S&P GSCI, there is a diversification benefit, though in the time period, the higher risk adjusted return of the DJCI outweighs the lower correlation of S&P GSCI by a small amount, adding an addition 20 basis points annually with 16 basis points less of risk, measured by standard deviation. Notice with the addition of commodities, the portfolio cumulative return consistently stays above a 50/50 stock/bond mix and far above equities alone.
If you have other ways to think about diversification, let us know so we can continue the analysis.
The posts on this blog are opinions, not advice. Please read our Disclaimers.