Get Indexology® Blog updates via email.

In This List

Gold Shines With Its Biggest 2-Day Gain Since 2011

Braced for Brexit

The Sun is Shining, Even on Fixed Income Indices in Mexico

Rieger Report: U.S. Bond Safety Valve for Brexit Hangover

Inside the S&P 500: The Real Estate Sector

Gold Shines With Its Biggest 2-Day Gain Since 2011

Contributor Image
Jodie Gunzberg

Former Managing Director, Head of U.S. Equities

S&P Dow Jones Indices

According to my colleague, Howard Silverblatt, Senior Index Analyst, “The S&P 500 posted a $317.2 billion fall, after Friday’s $656.9, making the two-day fall $974.2 billion – the third worst on record.  The 2-day point drop of 112.79 was the second worst point drop on record, and on a percentage basis, the 5.37% decline for 2-days is ranked 154.”  Sounds like a bad two days for the stock market and understandably so from the uncertainty of Brexit.

In the meantime, The S&P GSCI Gold Total Return gained 4.9% on Jun. 24-27, 2016, the most in two days since Aug. 8-9, 2011.  It is ranked the 31st biggest 2-day gain out of 7,644 and of these 31 times gold returned this much, the S&P 500 was only positive 10 of the times.  On the other hand, when the S&P 500 lost as much as 5.4% in 2 days in history the average drop was 7.2%, while gold gained 0.4% on average during these down stock market days.

Now may be a good time for gold and gold miners not only for it’s diversification properties but for its ability to hold up to a strengthening dollar and that it is seasonally a good time for gold.  Gold holds up well independently of the stock market. It also rises 32.5 basis points on average for every 1% the dollar rises, even though it rises much more, 3.5% for each 1% the dollar falls. Last, the 3rd quarter is historically the best for gold, gaining 4.7% on average, which is 40 basis points more than the S&P GSCI index in past 3rd quarters.

Source: S&P Dow Jones Indices
Source: S&P Dow Jones Indices.

Here are some thoughts from a recent Bloomberg radio appearance about Brexit on commodities including gold and North Sea Oil. Also here is why the relationship between Scotland and England matters for Brent Oil.

For the inside scoop, and for anyone having trouble tuning in, here are my notes to the radio producer about Brexit on commodities:

1. Fundamentally, it is too early to tell the impact of Brexit on commodities. Basically supply and demand should not change in the short term, but if Great Britain’s independence strengthens their productivity in the long run, the impact should be positive.

Interest rates and the dollar
Two potentially positive impacts on commodities would have been rising interest rates and a falling dollar. However the likelihood of either happening now is less so that is a bad sign for commodities.

Market Risk
Brexit is and may continue to drive market fear that bleeds across risky assets.

When this happens, commodity investors typically pull out since they don’t feel like they are getting compensated for the risk to “sell insurance” in the futures markets. The result is increased volatility and then a drop and open interest which is actually a force to make suppliers pullback that can drive up commodity prices in the long term despite short-term pain.

How to play
Right now the dollar strength and summer are the two key factors for commodities. Luckily the rising dollar doesn’t hurt commodities as much as a falling one helps; however, energy and industrial metals get hurt most. That said, gold, sugar and cattle tend to rise regardless of the dollar direction.
Hot weather in the summer is the other main factor driving commodities right now and q3 is typically best for the asset class. Historically unleaded gasoline, crude oil, precious metals and wheat do best in summer.

This may be time for gold
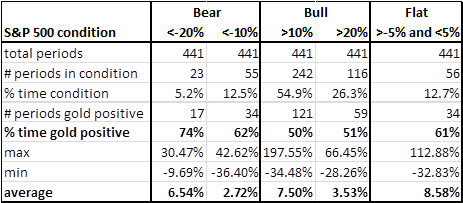
What is interesting is Brexit may be the cherry on top of the volatility crisis that will drive up gold.  Gold has always been a diversifier, with nearly zero correlation to the stock market and protects nicely. In history when the S&P 500 has fallen more than 10%, gold has gained about 60% of the time rising about 3% per month. Also if stocks fall more like 20% then gold gains more than double returning about 6.5% monthly. This plus its positive performance with the rising dollar and its best quarter coming, could drive it gold higher than in prior index history (gold levels at about $1800) given we haven’t seen an event like Brexit before.


The posts on this blog are opinions, not advice. Please read our Disclaimers.

Braced for Brexit

Contributor Image
Fei Mei Chan

Former Director, Core Product Management

S&P Dow Jones Indices

To say that global financial markets were surprised by results of the June 23rd Brexit referendum would be an understatement. Most market observers had anticipated a victory for Remain. When the Leave camp won, global financial markets reeled from the shock.

Low volatility strategies are designed to attenuate returns in either direction, and as such, mitigate the effects of days like June 24 and 27. The S&P 500 Low Volatility Index, for example, declined only 1.8% after last Friday and Monday’s tumultuous trading, a 3.5% outperformance compared to the broader S&P 500’s decline of 5.3%. Year-to-date, it is up 7.5% versus S&P 500’s -1.1% return. As the chart below shows, bracing also proved to be prudent across the U.S. market capitalization spectrum and outside the U.S. as well.

braced for brexit2

The posts on this blog are opinions, not advice. Please read our Disclaimers.

The Sun is Shining, Even on Fixed Income Indices in Mexico

Contributor Image
Jaime Merino

Former Director, Asset Owners Channel

S&P Dow Jones Indices

When analyzing Mexican fixed income indices during the summer (June 20 to September 20), we have seen trends over the past 15 years. We know that through the years, economic and momentum factors are not the same, and what happened in Mexico last year can’t be compared with what happened 10 years ago.  Instead, let’s focus on how the annualized returns of some fixed income indices have behaved historically during this period of the year.

Exhibit 1 shows the indices analyzed and their reference numbers, and Exhibit 2 shows the results.

Capture

Capture

Historically, we can see that the probability of generating a positive return has been high, with 7 out of 10 indices showing positive returns during the summer 100% of the time.  The S&P/Valmer Mexico Sovereign International UMS Index had the lowest percent of positive returns, at 75%, and the S&P/Valmer Mexico Sovereign 10 Year MBONOS Index and the S&P/Valmer Mexico Sovereign MBONOS Index had negative returns for their first and first two years, respectively.

There are high return expectations for most of the indices.  During the period of June 20 to September 20 from 2001 to 2015, the lowest average return was for the S&P/Valmer Mexico Sovereign 7+ CETES Index, at 6.05%, and the highest average return was for the S&P/Valmer Mexico Sovereign International UMS Index, at 17.23%.  Over the same 15-year period, the sovereign curve, as measured by the S&P/Valmer Mexico Sovereign MBONOS Index, had an average return of 9.71%, a maximum return of 28.53%, and a minimum return of -8.26%.  The sovereign real rate, as measured by the S&P/Valmer Mexico Sovereign Inflation-Linked UDIBONOS Index, had an average return of 13.23%, and the S&P/Valmer Mexico Corporate Index had an average return of 8.66%.  Measuring maximums and minimums, the index with the most dispersion was the S&P/Valmer Mexico Sovereign International UMS Index, with a maximum return of 61.23% and a minimum return of -18.74%, followed by the S&P/Valmer Mexico Sovereign 10 Year MBONOS Index, with a maximum return of 35.55% and a minimum return of -27.62%.

We know that past performance doesn’t guarantee future results, but it can give us a view on how some indices might move.  Stay tuned for the next season report.

The posts on this blog are opinions, not advice. Please read our Disclaimers.

Rieger Report: U.S. Bond Safety Valve for Brexit Hangover

Contributor Image
J.R. Rieger

Former Head of Fixed Income Indices

S&P Dow Jones Indices

Thursday’s Brexit vote and subsequent market reactions have helped push U.S. bonds higher as investors continue to seek shelter from volatility and the uncertainty of what the future holds for the global economy.

While the S&P 500 Index has seen a decline of over 2.7% in June, the 10 year U.S. Treasury Bond has returned over 2.5% for the month so far as the “risk off” mindset helps push yields lower and bond prices higher.

In the credit markets, U.S. municipal bonds tracked in the  S&P Municipal Bond Index have returned over 1.5% in June as the diversity, yield, historical stability and quality of the municipal bond market has made it a “risk off” destination asset class.  The corporate bonds of the companies in the S&P 500 have also seen positive returns with the S&P 500 Investment Grade Corporate Bond Index returning over 1.25% for June so far.

Table 1: Select indices and their returns through June 24, 2016:

Source: S&P Dow Jones Indices, LLC. Data as of June 24, 2016. Table is provided for illustrative purposes. It is not possible to invest directly in an index. Past performance is no guarantee of future results.

As a result of the Brexit vote, the financial sector to a beating.  However, the bonds of the financial companies in the U.S. have stayed in positive territory with the S&P 500 Financials Corporate Bond Index returning just under 1% through June while the equity market sector tracked in the S&P 500 Financials (TR) has seen extreme volatility to the down side of more than 6.5%.

Table 2: Select financial sector indices and their returns through June 24, 2016:

Source: S&P Dow Jones Indices, LLC. Data as of June 24, 2016. Table is provided for illustrative purposes. It is not possible to invest directly in an index. Past performance is no guarantee of future results.


The posts on this blog are opinions, not advice. Please read our Disclaimers.

Inside the S&P 500: The Real Estate Sector

Contributor Image
David Blitzer

Former Managing Director and Chairman of the Index Committee

S&P Dow Jones Indices

Part of the power of the S&P 500 is analyzing the market and gaining insights into which stocks rising or falling.  The key to these analyses is GICS – the Global Industry Classification Standard – which is used to define the sectors and industries in the index. GICS is jointly maintained by S&P Dow Jones Indices and MSCI.  The classifications are used across the S&P indices so that analysts have a consistent picture whether they look at large cap versus small cap or foreign versus domestic.

GICS goes back to 1999 and divides the world of equities into 10 sectors, 24 industry groups, 68 industries and 157 sub-industries. Because lots has changed since 1999, GICS is reviewed each year to assure that it remains relevant. Among those changes is the increasing interest in investing in real estate through equities and the growing popularity of real estate investment trusts (REITs). REITs are taxed differently from most corporations and are required to distribute a large portion of their income. REITs are seen as attractive income oriented dividend paying investments.

When GICS was introduced in 1999, REITs were considered alternative investments and rarely found in mainstream indices. The initial recognition step came in 2001 when S&P Dow Jones Indices, after a market consultation, decided that REITs would be eligible for inclusion in the S&P 500.  At that time REITs and other real estate development companies were grouped together with the financials under GICS. Periodically investors would suggest that real estate or REITs were lost amidst the banks and brokers and should stand on their own. Over the last few years, as S&P Dow Jones Indices and MSCI reviewed GICS, we heard more and more about real estate and REITs. (The chart shows the increasing real estate share in the S&P 500’s market value compared to financials excluding real estate.) Based on comments from investors, the real estate industry and others, S&P Dow Jones Indices and MSCI announced in March 2015 that real estate would leave the financial sector and become its own 11th sector in GICS.  The move for GICS is at the end of August, the shift in S&P Dow Jones Indices will be the rebalance on September 16th.

This is not just rearranging the place cards on the table. The GICS sectors are widely used to gauge how asset allocations align with markets. With real estate added to the top line of sectors, investors will notice where real estate is and whether they are over or under weighted. Analyses of market movements and fundamentals will focus on real estate the same way they focus on industrials or technology. With real estate removed from the financials, the reported dividend yield for financials will drop a bit as real estate moves to be among the higher yielding sector in the 11, along with telecommunication services and utilities.

With the change to GICS, real estate and REITs will garner more discussion and ink. Already analysts, ETF issuers and the media are paying increasing attention to the new sector-to-be.  Those who thought the financial crisis ended real estate investing were wrong; real estate and REITs are an important part of the market. With the new GICS sector, REITs will get increased attention. Greater attention is not a guarantee of investment results.

The posts on this blog are opinions, not advice. Please read our Disclaimers.