The year 2016 appears to have gotten off to a similar start to the beginning of 2015. The S&P 500® Bond Index has returned 0.92% as of Feb. 8, 2016, while in 2015 the index was up 1.57% as of Feb. 8, 2015. Maybe the month of February will end up being more similar than investors might want. The yield-to-worst of the S&P 500 Bond Index ended February 2015 13 bps wider than where it began the month. The same might be true this year, as the yield of the index, at 3.55% as of Feb. 8, 2016, is almost even to January’s 3.56% so the question is whether yields widen out from here as they did last year.
By now, many have heard the news go on about the lower prices of oil and materials. The S&P 500 Energy Corporate Bond Index has lost 3.71% YTD, followed by a 0.87% YTD drop in the S&P 500 Materials Corporate Bond Index.
Unlike recent index performance, January’s and February’s spread widening has crept into industry sectors other than energy and materials. Excluding energy and materials, the largest changes in option adjusted spread (OAS) to U.S. Treasuries have been seen in the telecommunication services (up 51 bps) and consumer discretionary (up 41 bps) sectors.
Exhibit 1: OAS History of the S&P 500 Bond Index Industry Sectors
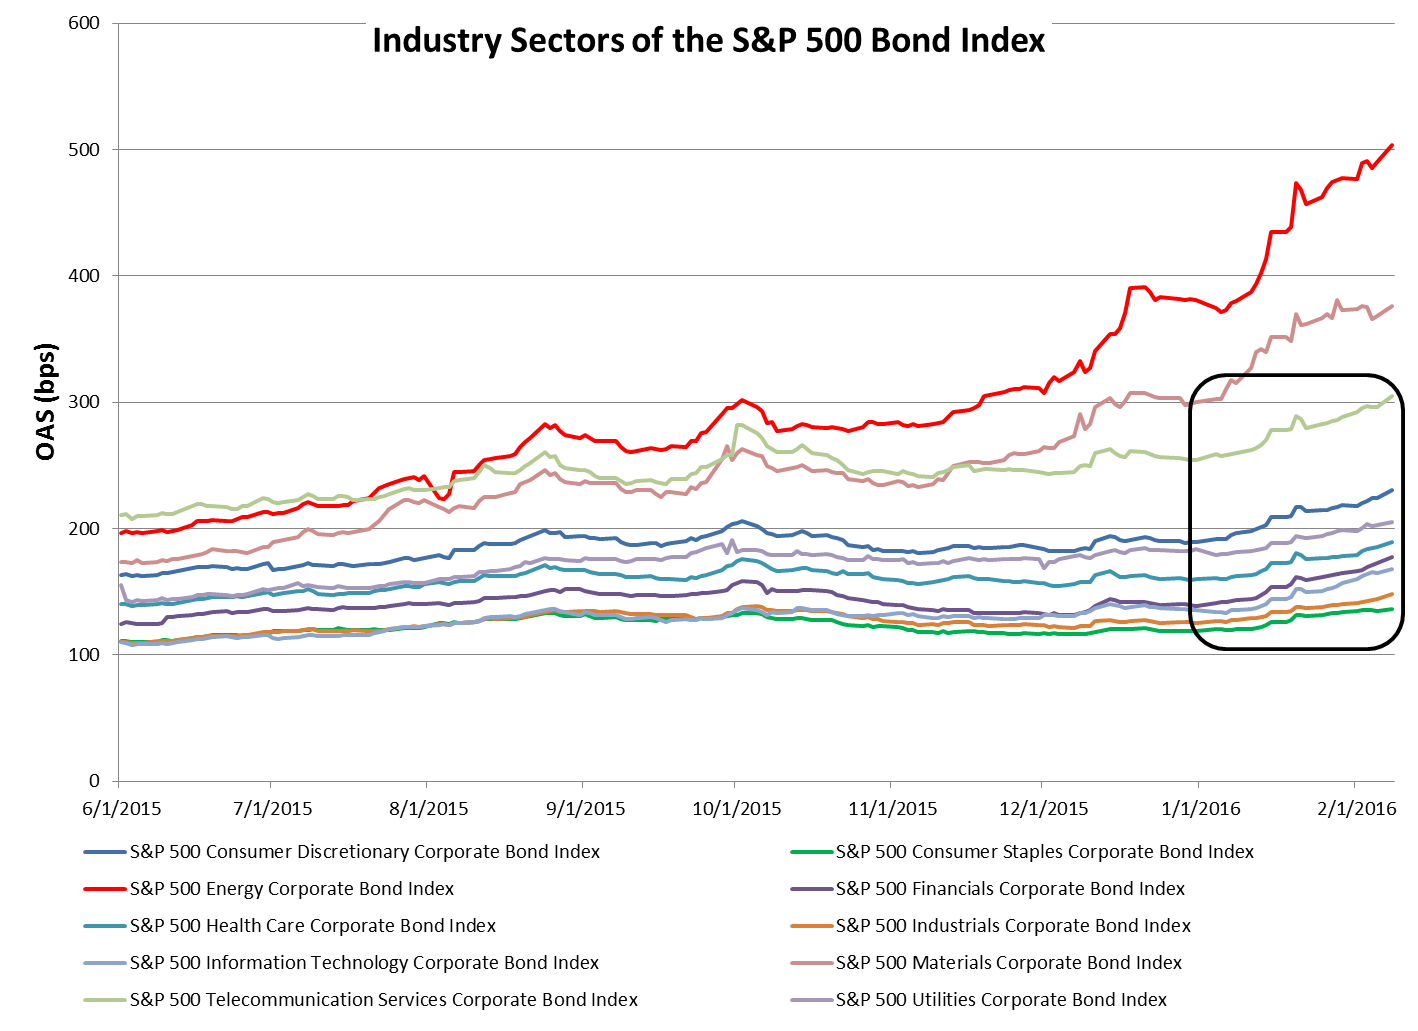
Source: S&P Dow Jones Indices LLC. Data as of Feb. 8, 2016. Past performance is no guarantee of future results. Chart is provided for illustrative purposes.
Related to the widening of the industry sector spreads is the widening of the credit rating indices. Of note is that the current OAS level of 235 bps for the S&P 500 BBB Investment Grade Corporate Bond Index has risen close to the starting point of 287 bps seen back in June 2015 for the S&P 500 BB High Yield Corporate Bond Index.
Exhibit 2: OAS History of the S&P 500 Bond Index Rating Categories
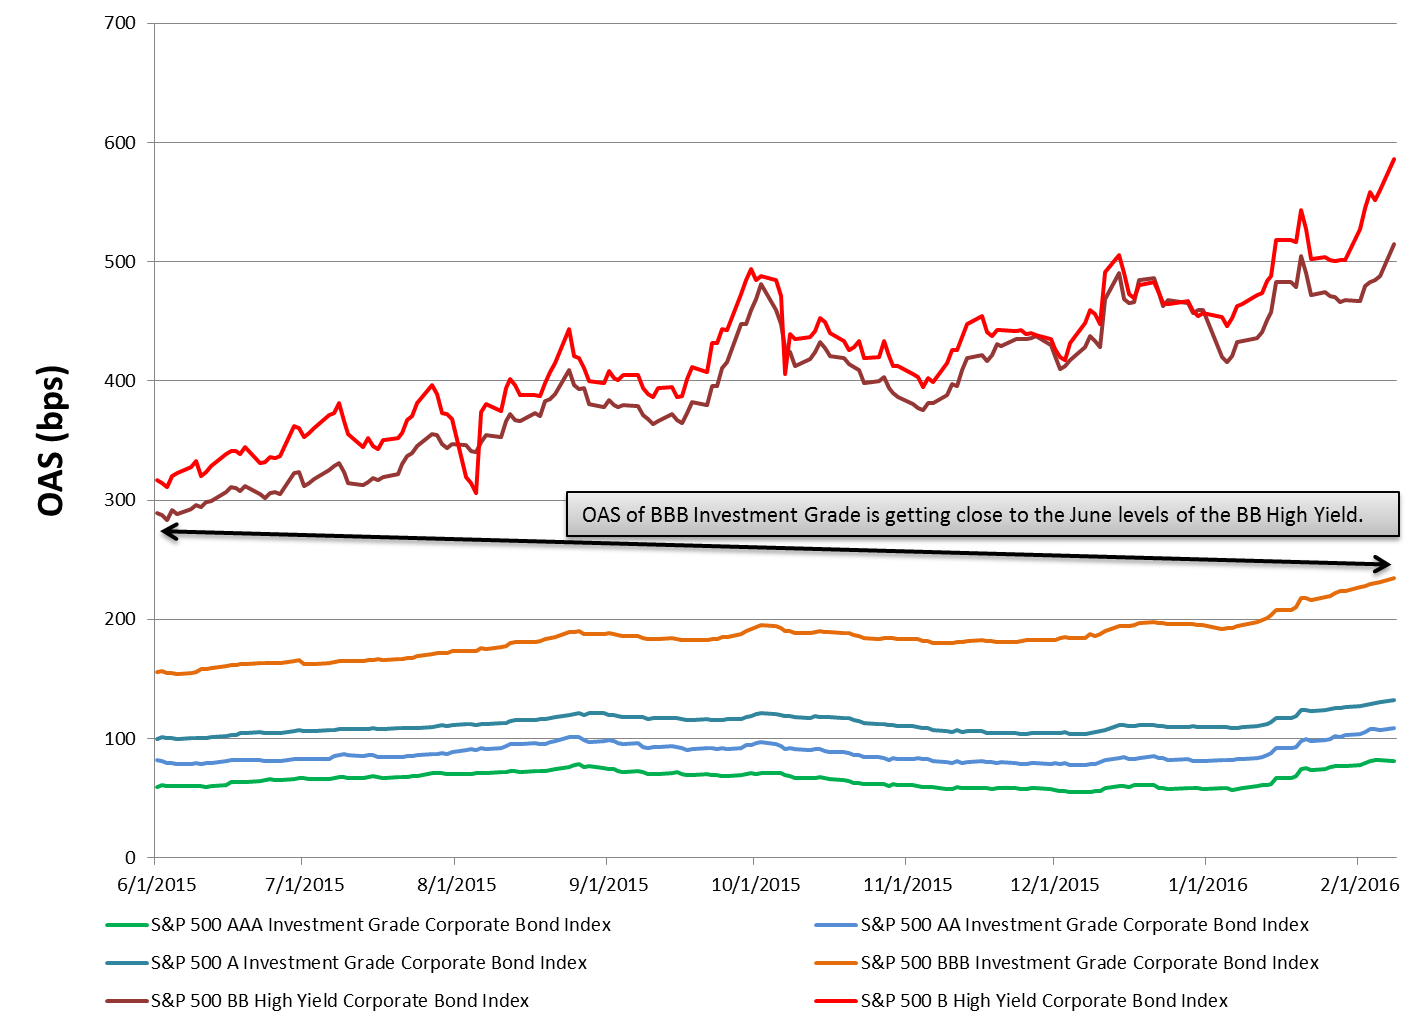
Source: S&P Dow Jones Indices LLC. Data as of Feb. 8, 2016. Past performance is no guarantee of future results. Chart is provided for illustrative purposes.
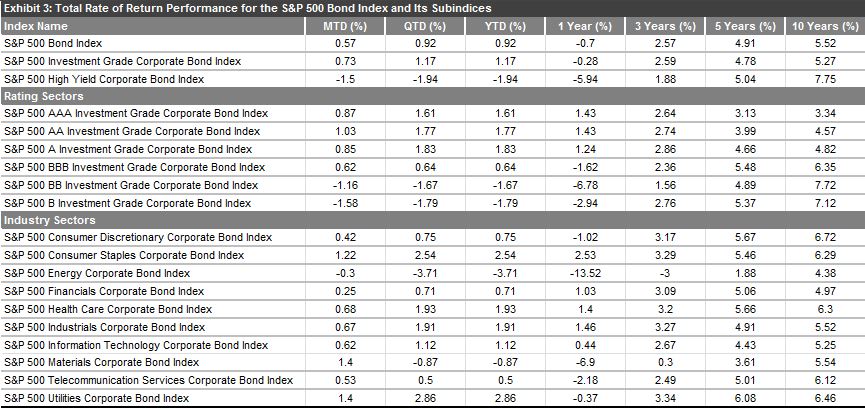
Source: S&P Dow Jones Indices LLC. Data as of Feb. 8, 2016. Past performance is no guarantee of future results. Table is provided for illustrative purposes.
The posts on this blog are opinions, not advice. Please read our Disclaimers.

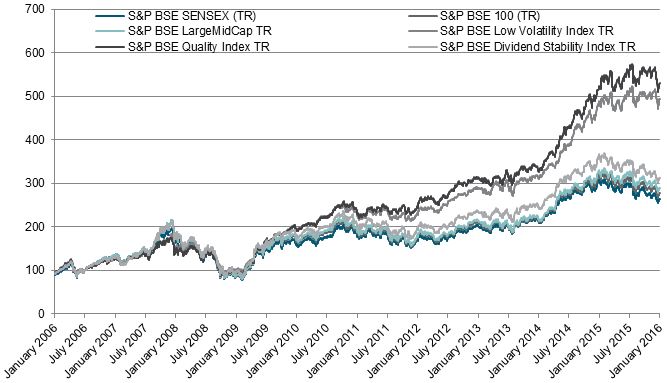 Source: Asia Index Private Limited. Data from Jan. 31, 2006, to Feb. 1, 2016. Past performance is no guarantee of future results. Chart is provided for illustrative purposes and reflects hypothetical historical performance.
 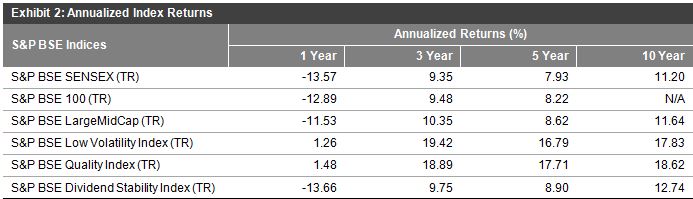 Source: Asia Index Private Limited. Data as of Jan. 29, 2016. Table is provided for illustrative purposes and reflects hypothetical historical performance. TR refers to Total Return and includes dividends.
 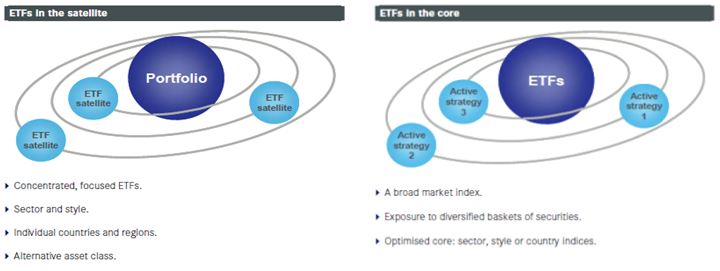 Source: S&P Dow Jones Indices LLC. Charts are provided for illustrative purposes.