Globally, passive investment products have amassed significant assets. According to ETFGI, the global assets parked in ETFs and ETPs stood at USD 2.971 trillion at the end of Q2 2015, surpassing the level of global hedge fund assets. The introduction of smart beta ETFs and ETPs has made it possible to gain exposure to certain risk factors through a passive route based on indices. An inherent advantage of the use of indices to incorporate risk factors, apart from the lower cost and tax efficiency, is transparency. According to ETFGI, as of October 2015, globally, smart beta equity ETFs and ETPs had assets of USD 399 billion. The U.S. and Europe have been at the forefront of passive smart beta adoption, with the Asia-Pacific region swiftly catching up on the smart beta wave. Within the Asia-Pacific region, India currently has one smart beta product based on dividends.
A factor-based portfolio allocation strategy aims to offer diversification benefits, as individual factors have generally low correlation with each other. These factors aim to help explain the sources of portfolio returns. Asia Index Private Limited, a joint-venture between S&P Dow Jones Indices and BSE, recently launched a suite of factor indices for the Indian equity market, designed to individually capture the low-volatility, momentum, quality, and value factors. These four factors are grounded in academic literature and have empirically shown their own risk premia. Let us take a quick look at the performance of these factor indices. Exhibit 1 shows the cumulative relative performance of these indices with respect to the S&P BSE SENSEX. Each factor index noted its own cycle over the past 10 years ending Nov. 30, 2015. From Exhibit 2, we can note that over the same 10-year period, the S&P BSE Momentum Index and the S&P BSE Enhanced Value Index had the lowest correlation of monthly returns, while the S&P BSE Low Volatility Index and the S&P BSE Quality Index had the highest correlation of monthly returns.
Exhibit 1: Cumulative Relative Returns
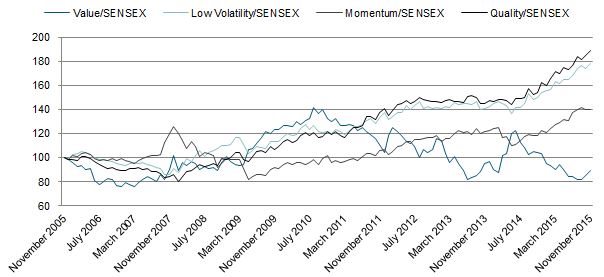
Source: S&P Dow Jones Indices LLC. Data from Nov. 30, 2005, to Nov. 30, 2015. Past performance is no guarantee of future results. Chart is provided for illustrative purposes and reflects hypothetical historical performance. The S&P BSE Momentum Index, S&P BSE Enhanced Value Index, S&P BSE Low Volatility Index, and S&P BSE Quality Index were launched on Dec. 3, 2015.
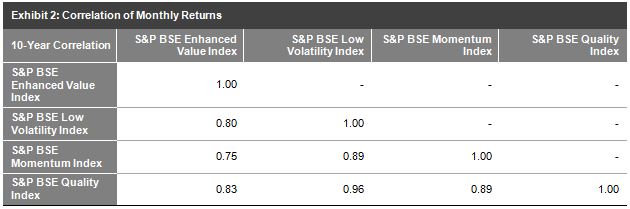
Source: S&P Dow Jones Indices LLC. Data from Nov. 30, 2005, to Nov. 30, 2015. Past performance is no guarantee of future results. Table is provided for illustrative purposes and reflects hypothetical historical performance. The S&P BSE Momentum Index, S&P BSE Enhanced Value Index, S&P BSE Low Volatility Index, and S&P BSE Quality Index were launched on Dec. 3, 2015.
The posts on this blog are opinions, not advice. Please read our Disclaimers.