


How has equal-weight compared with cap-weight historically? S&P DJI’s Hamish Preston and Invesco’s Nick Kalivas explore how differences in index construction have influenced index performance, sector and factor composition, and results in the latest SPIVA Scorecards.
The posts on this blog are opinions, not advice. Please read our Disclaimers.Lessons from 20 Years of Equal Weight
The S&P GSCI Cooled in April as Inflation Cooled
Equally Weighting within Sectors: Impact and Potential Applications
Potential Applications of U.S. Equities for Asia-Based Investors
Exploring Two Decades of Fixed Income Innovation
Lessons from 20 Years of Equal Weight
The S&P GSCI Cooled in April as Inflation Cooled

- Categories Commodities
- Tags agriculture, commodities, copper, energy, gold, grains, industrial metals, inflation, S&P GSCI, S&P GSCI Agriculture, S&P GSCI Climate Aware, S&P GSCI Copper, S&P GSCI Grains, S&P GSCI Industrial Metals, S&P GSCI Softs, S&P GSCI Sugar, S&P GSCI Zinc, soft commodities, sugar, Zinc
The S&P GSCI fell 0.8% in April as the Fed’s preferred measure of inflation, Personal Consumption Expenditures (PCE), fell slightly on a year-over-year basis to 4.6%. Continued elevated readings of inflation, albeit cooling, led to market expectations that the Fed would hike rates again in May to bring inflation back to its 2% target. Commodities are generally good inflation hedges because they tend to move with changes in inflation to the upside and, most recently, to the downside.
Within the broad S&P GSCI benchmark, several commodity sectors declined, with the S&P GSCI Industrial Metals falling the most, down 3.0%. The S&P GSCI Copper and the S&P GSCI Zinc dragged down performance, as China’s Politburo stated their economy is still in a recovery phase, which will require continued fiscal and monetary support due to insufficient domestic demand. Expectations for China’s industrial sector to pick up on the demand side have not come to fruition yet, and recent issues with trade relations between Australia and China have not helped the industrial metals space.
The S&P GSCI Agriculture was the second-worst-performing sector, down 2.9% in April, with the S&P GSCI Grains the lowest performer, down 6.9%. Corn, soy and wheat were all dragged lower owing to strong crop progress and waning demand, as the U.S. Department of Agriculture said private exporters recently canceled several hundred thousand tons of corn. Brazil has a massive corn crop this year, and their less expensive crop has weighed on U.S. grain prices. The S&P GSCI Softs rose 12.3%, powered by the S&P GSCI Sugar, which rose 22.1% to a new 10-year high.
Competing forces were at play for the S&P GSCI Energy, leading to flat performance for the month. This sector constitutes more than half of the weight in the headline S&P GSCI and tends to have the highest inflation beta (or sensitivity to changes in inflation) of all commodities. Our recently launched S&P GSCI Climate Aware is the first-to-market commodities benchmark incorporating environmental considerations, and currently has a third of its weight toward energy commodities.
The S&P GSCI Gold flirted with a new all-time high as the U.S. dollar moved lower and uncertainty across markets led to a safe-haven bid.
The posts on this blog are opinions, not advice. Please read our Disclaimers.Equally Weighting within Sectors: Impact and Potential Applications

The outperformance of equal weight indices is well documented, especially for the S&P 500® Equal Weight Index’s 20 years of live history. Equal Weight’s relative returns reflect the impact of several important index characteristics. For example, smaller-size exposure and (anti-) momentum effects together account for around 75% of the historical variation of its relative returns.
Elevated sector dispersion has made sector allocations more important in explaining Equal Weight’s recent relative returns. Indeed, the S&P 500 Equal Weight Index’s greater exposure to Energy and lower exposure to Communication Services, Information Technology and Consumer Discretionary accounted for around two-thirds of its 7% outperformance in 2022. These exposures also helped to explain the index’s underperformance in Q1 2023.
At the same time, it’s important not to overlook the impact of equal weighting within each sector. To see why, we construct hypothetical “intermediate” portfolios that represent steps along distinct paths between the S&P 500 and the S&P 500 Equal Weight Index. Exhibit 1 summarizes these two hypothetical paths.
The hypothetical “Sectors Matching EQW” portfolio adjusts S&P 500 sector weights so that they match those of the Equal Weight Index while ensuring that companies within the same sector remain float market-cap weighted. Alternatively, the hypothetical “EQW Within Sectors” portfolio retains the S&P 500’s sector allocations but weights every name equally within each sector.

Exhibit 2 shows that equally weighting within each sector mattered more when explaining the S&P 500 Equal Weight Index’s historical returns. Indeed, the cumulative total return for the hypothetical “EQW Within Sectors” portfolio is graphically indistinguishable from that of the S&P 500 Equal Weight Index. While the equal weight index may have sporadically benefited from its distinct sector allocations, having more exposure to the smaller names within each sector was the most important driver of the S&P 500 Equal Weight Index’s returns.

The relative degree of concentration within sectors suggests a potential tactical application. Exhibit 3 shows the distribution of adjusted Herfindahl-Hirschman Index (HHI) figures for the S&P 500 and its 11 GICS sectors; a higher adjusted HHI figure means that concentration is higher, independent of the number of stocks in each index. The current concentration is elevated in several sectors, particularly in Information Technology.
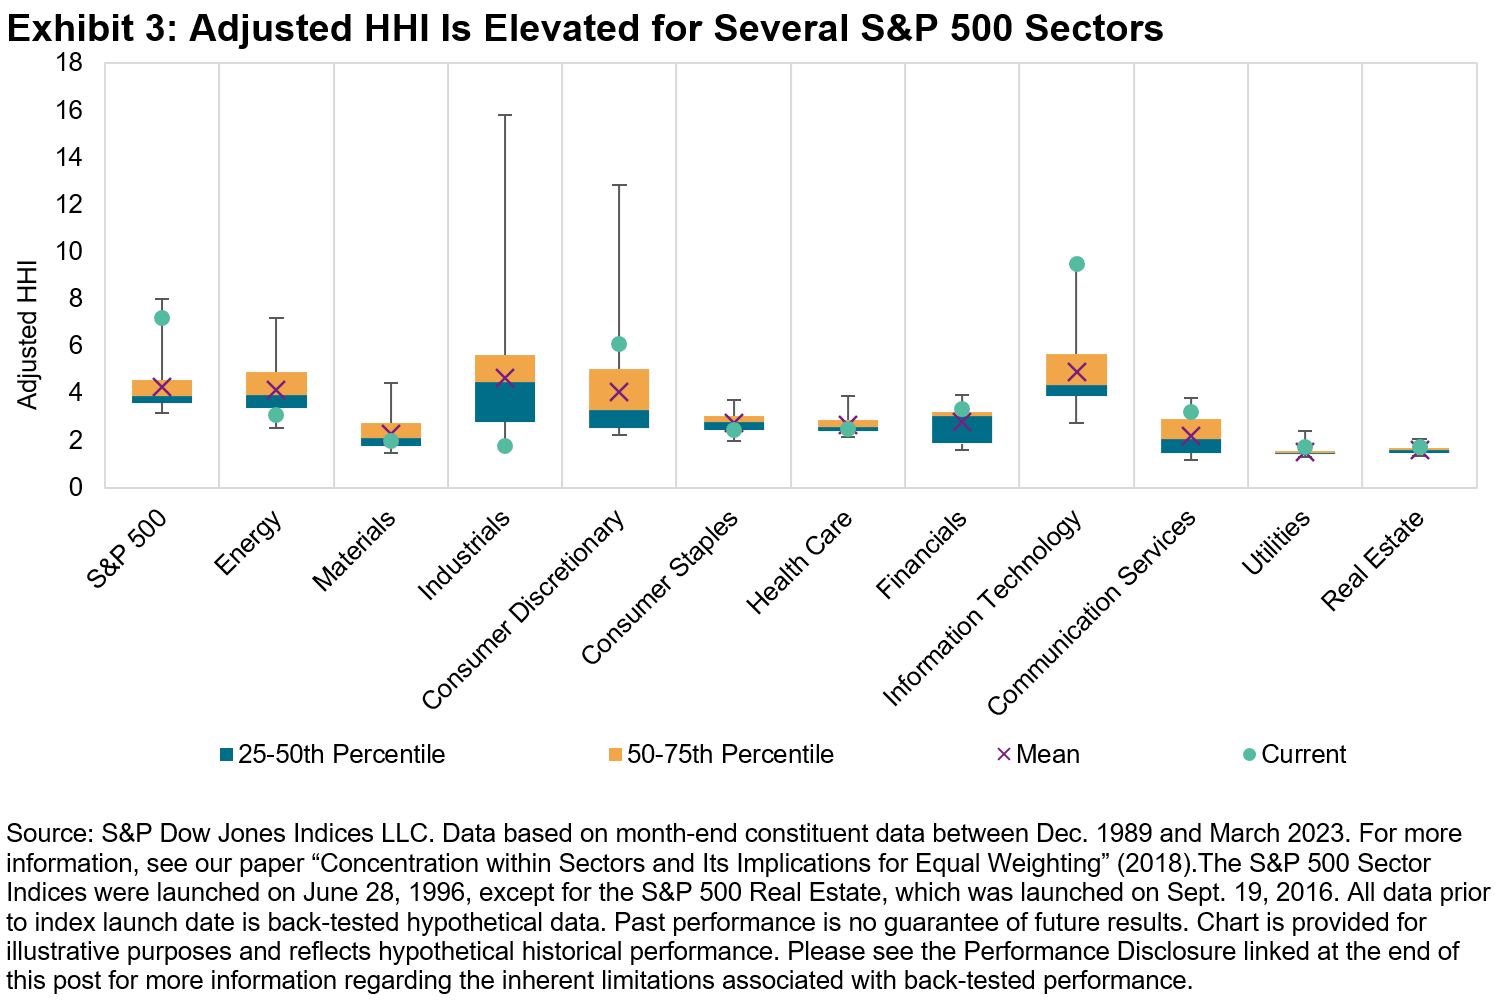
By definition, equally weighted sector indices have less exposure to larger names than do their float market-cap counterparts. All else equal, falling concentration indicates underperformance from the largest names, and vice-versa. Hence, one would expect equally weighted sectors to outperform when concentration falls.
Exhibit 4 confirms this expectation: the S&P 500 Equal Weight Information Technology Index typically outperformed its float market-cap counterpart when the sector’s adjusted HHI declined. Hence, to the extent that current concentration levels decline, market participants may wish to consider the potential applications of an equally weighted sector strategy.

For more information on the interaction between concentration and equal weight performance, and to celebrate the S&P 500 Equal Weight Index’s 20th birthday, check out the replay of our Index Investment Strategy call from April 20, 2023.
The posts on this blog are opinions, not advice. Please read our Disclaimers.Potential Applications of U.S. Equities for Asia-Based Investors

Many investors have a so-called “home bias,” allocating to their domestic market in greater proportion than would be expected based on its representation in global equity markets. Asia-based investors are no exception. Here we present our U.S. equity icons as one potential way to provide diversification for Asian investors.
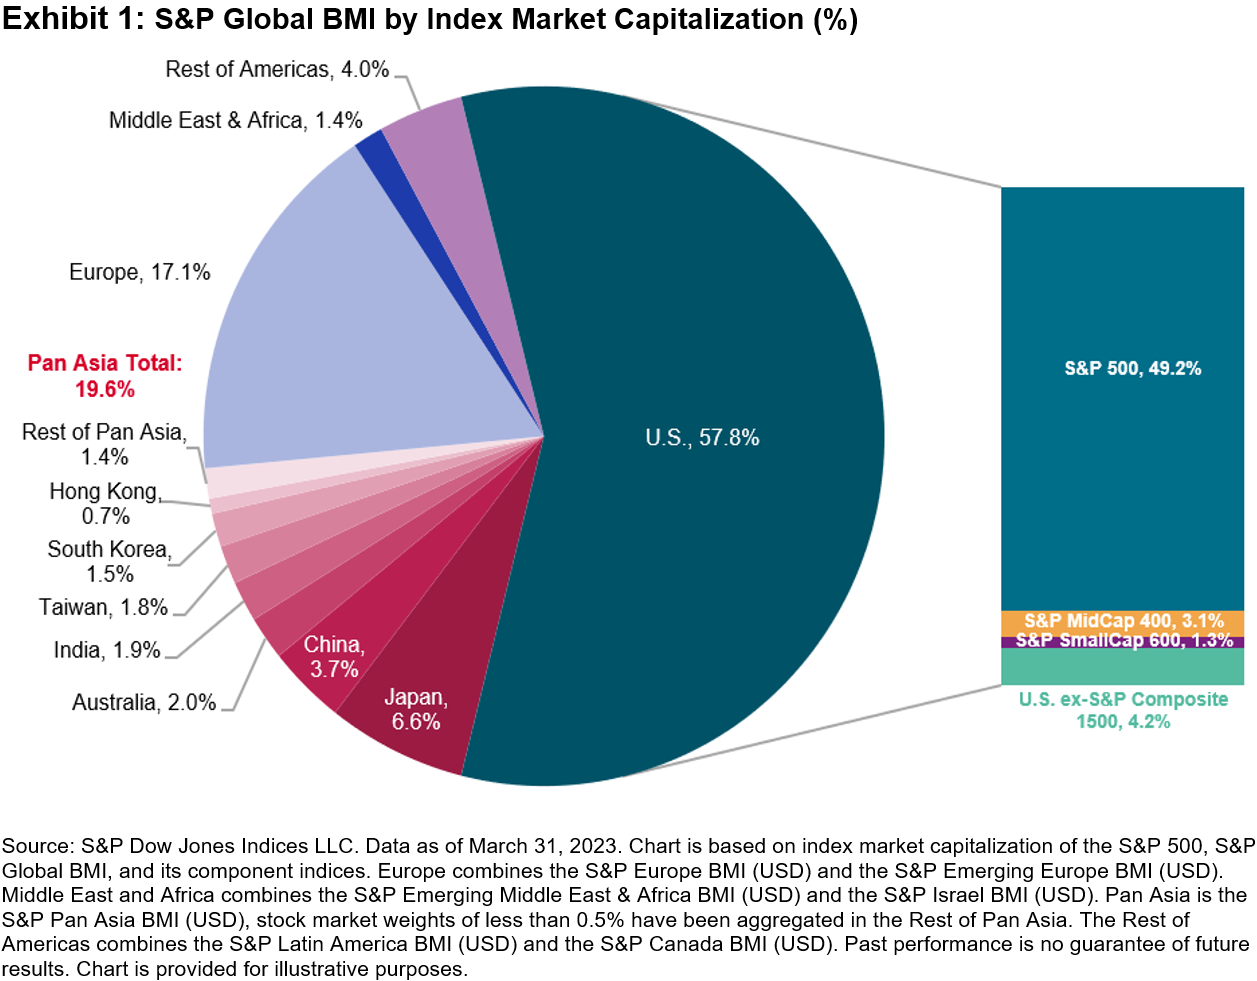
The breadth and depth of the U.S. equity market means that investors risk overlooking a significant chunk of the global equity opportunity set by under-allocating to U.S. equities, which may result in a large active share compared to a global benchmark. For example, Exhibit 1 shows that the U.S. was nearly three times larger than the entire investable Asian equity market, with smaller U.S. equity segments as large as entire local stock markets. The S&P 500® makes up nearly half of the pie, with the S&P MidCap 400® and SmallCap 600® being larger than the Australian and Hong Kong stock markets, respectively.
Beyond U.S. equities representing a significant portion of the global opportunity set, their distinct sector weights may help investors to overcome domestic sector biases. Exhibit 2 shows GICS® sector weights of the S&P Pan Asia BMI and the relative weight compared to the S&P Global BMI and the S&P 500. The S&P Pan Asia BMI’s largest weights are in Financials (17%) and Information Technology (16%), with its smallest weight in the Energy sector, at 3%. Some key differences between the S&P Pan Asia BMI and S&P Global BMI and S&P 500 are that the global and U.S. benchmarks have a larger weight in Health Care and Information Technology and lower weights in Consumer Discretionary, Materials and Industrials.

The performance of U.S. equities may also motivate some to consider incorporating U.S. equities alongside domestic equities. Exhibit 3 shows the cumulative performance, in USD terms, of the S&P Pan Asia BMI versus U.S. equity indices since Dec. 30, 1994. The right-hand bar chart shows the annualized total returns of various single stock market indices against the S&P 500, S&P MidCap 400, S&P SmallCap 600 and DJIA®. Quite clearly, the U.S. equity indices outperformed, historically.

Exhibit 4 shows that the outperformance of U.S. equities was not driven by currency effects. Indeed, the S&P 500 outperformed single-market indices (as represented by the S&P Global BMI sub-indices) in local currency terms as well.
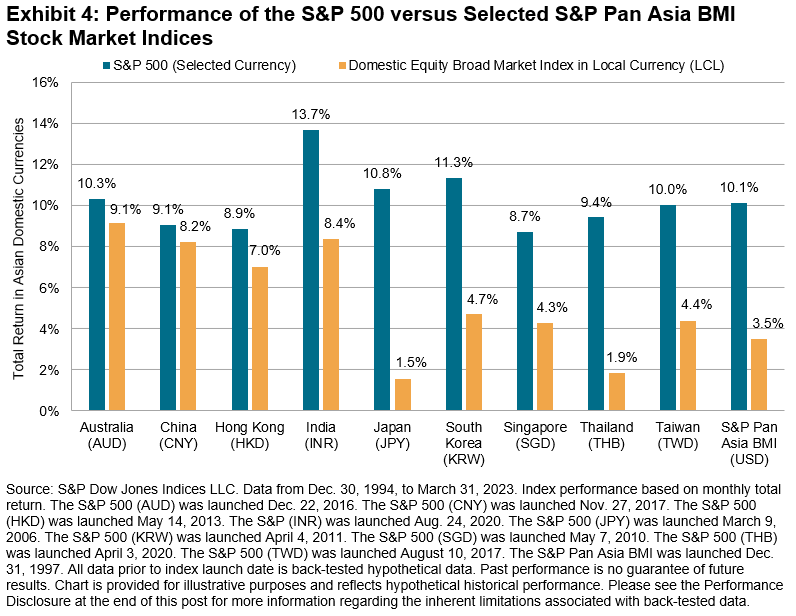
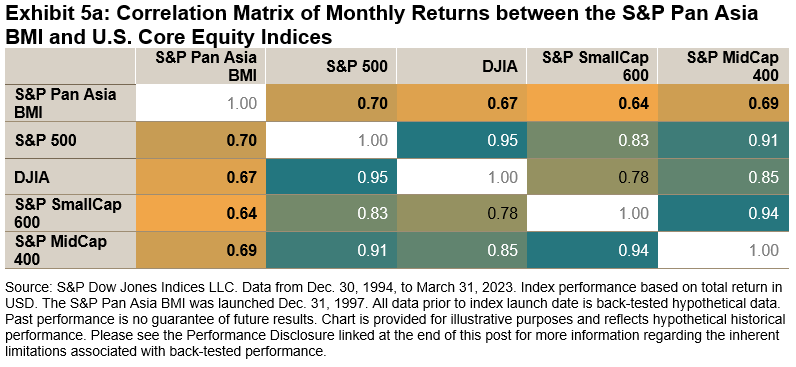
Exhibit 5a also shows the potential diversification benefit of incorporating U.S. equities: there was a non-perfect correlation with Asian equities over the last 28 years. Exhibit 5b also highlights that several single-market indices rank significantly lower in terms of correlation, with China having a 0.4 correlation to the U.S. since Dec. 30, 1994.

Unsurprisingly, perhaps, incorporating allocations to the S&P 500 could have improved risk-adjusted returns. For example, Exhibit 6 shows the annualized returns and volatility for various hypothetical combinations of the S&P 500 and the S&P Pan Asia BMI. These hypothetical combinations rebalance back to the target weights at each year end.
Portfolios that included some proportion of the S&P 500 posted higher returns than a 100% allocation to the S&P Pan Asia BMI. The high returns were also achieved at a lower annualized risk.

Check out more research and insights on the S&P 500 and DJIA at https://www.spglobal.com/spdji/en/education/article/comparing-iconic-indices-the-sp-500-and-djia/ and https://www.spglobal.com/spdji/en/education/article/regional-relevancy-of-sp-500-and-dow-jones-industrial-average-futures-in-asia.
The posts on this blog are opinions, not advice. Please read our Disclaimers.Exploring Two Decades of Fixed Income Innovation
- Categories Fixed Income
- Tags Active vs. Passive, Bond ETFs, bond yields, Brian Luke, credit risk management, derivatives, duration risk management, fixed income, Fixed Income ETFs, fixed income mutual funds, futures, high yield corporates, iBoxx, income generation, indexing, interest rate management, investment grade corporates, iTraxx, liquidity, options, rising rates, S&P Indices vs. Active, SPIVA, total return swaps
Take a closer look at the latest SPIVA results as S&P DJI’s Brian Luke and BlackRock’s Stephen Laipply discuss how indexing works for fixed income, the iBoxx liquidity ecosystem, and what a growing range of passive tools could mean for yield seekers as income returns to fixed income.
The posts on this blog are opinions, not advice. Please read our Disclaimers.