Get Indexology® Blog updates via email.

In This List

Equally Weighting within Sectors: Impact and Potential Applications

Potential Applications of U.S. Equities for Asia-Based Investors

Exploring Two Decades of Fixed Income Innovation

The Same, Only Different

Global Islamic Indices Gained over 10% in Q1 2023, Outperforming Conventional Benchmarks

Equally Weighting within Sectors: Impact and Potential Applications

Contributor Image
Hamish Preston

Head of U.S. Equities

S&P Dow Jones Indices

The outperformance of equal weight indices is well documented, especially for the S&P 500® Equal Weight Index’s 20 years of live history. Equal Weight’s relative returns reflect the impact of several important index characteristics. For example, smaller-size exposure and (anti-) momentum effects together account for around 75% of the historical variation of its relative returns.

Elevated sector dispersion has made sector allocations more important in explaining Equal Weight’s recent relative returns. Indeed, the S&P 500 Equal Weight Index’s greater exposure to Energy and lower exposure to Communication Services, Information Technology and Consumer Discretionary accounted for around two-thirds of its 7% outperformance in 2022. These exposures also helped to explain the index’s underperformance in Q1 2023.

At the same time, it’s important not to overlook the impact of equal weighting within each sector. To see why, we construct hypothetical “intermediate” portfolios that represent steps along distinct paths between the S&P 500 and the S&P 500 Equal Weight Index. Exhibit 1 summarizes these two hypothetical paths.

The hypothetical “Sectors Matching EQW” portfolio adjusts S&P 500 sector weights so that they match those of the Equal Weight Index while ensuring that companies within the same sector remain float market-cap weighted. Alternatively, the hypothetical “EQW Within Sectors” portfolio retains the S&P 500’s sector allocations but weights every name equally within each sector.

Exhibit 2 shows that equally weighting within each sector mattered more when explaining the S&P 500 Equal Weight Index’s historical returns. Indeed, the cumulative total return for the hypothetical “EQW Within Sectors” portfolio is graphically indistinguishable from that of the S&P 500 Equal Weight Index. While the equal weight index may have sporadically benefited from its distinct sector allocations, having more exposure to the smaller names within each sector was the most important driver of the S&P 500 Equal Weight Index’s returns.

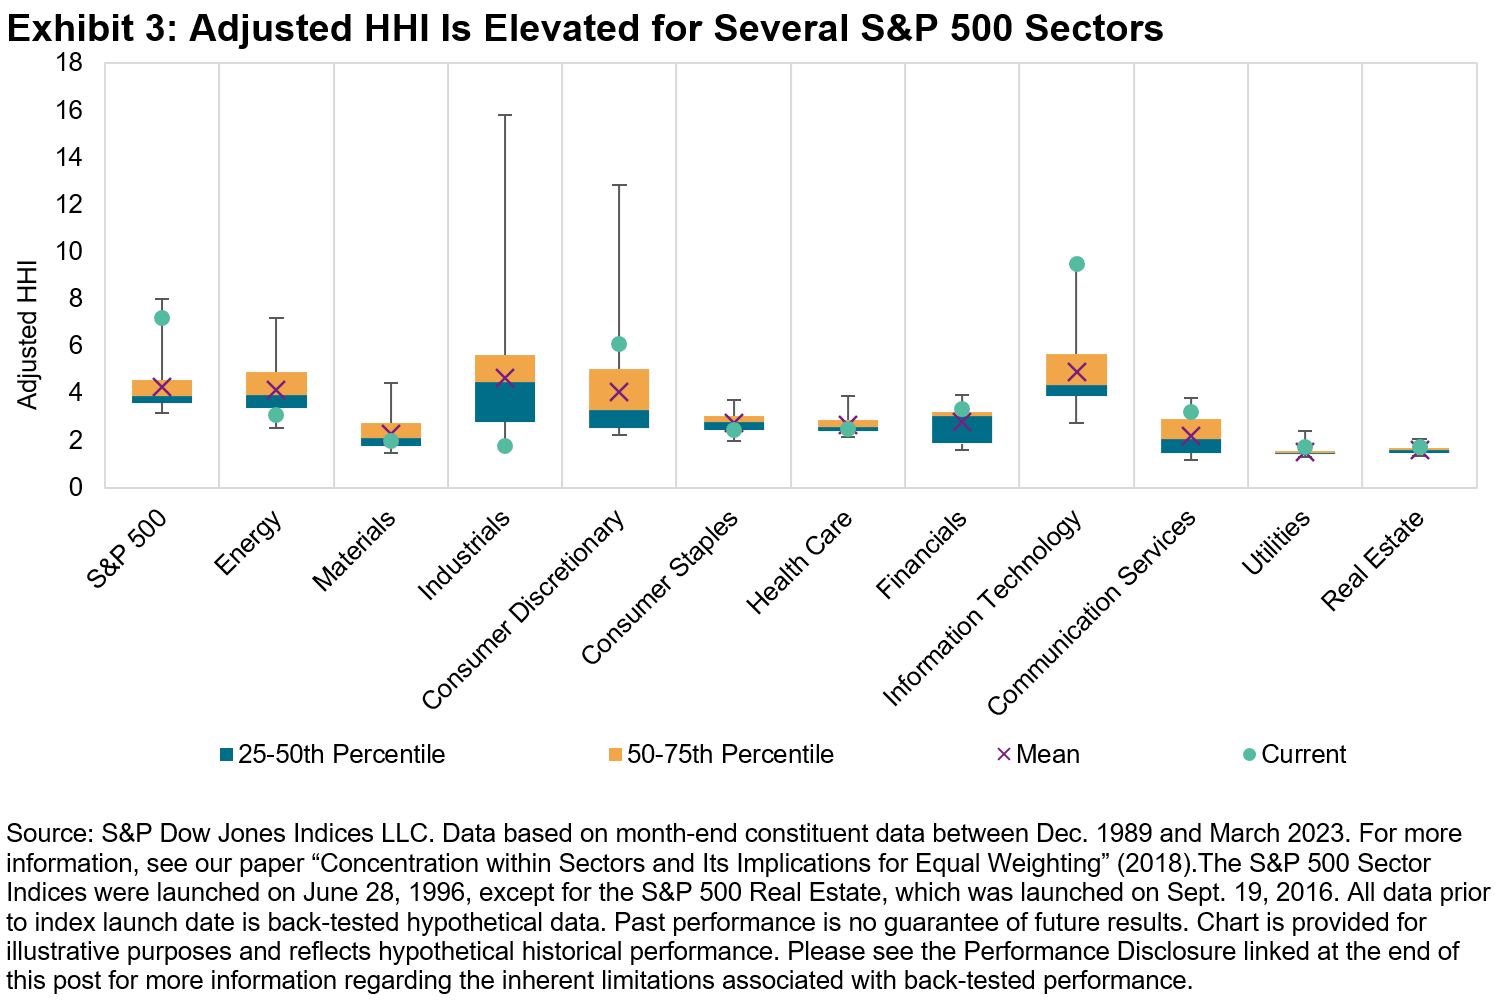
The relative degree of concentration within sectors suggests a potential tactical application. Exhibit 3 shows the distribution of adjusted Herfindahl-Hirschman Index (HHI) figures for the S&P 500 and its 11 GICS sectors; a higher adjusted HHI figure means that concentration is higher, independent of the number of stocks in each index. The current concentration is elevated in several sectors, particularly in Information Technology.

By definition, equally weighted sector indices have less exposure to larger names than do their float market-cap counterparts. All else equal, falling concentration indicates underperformance from the largest names, and vice-versa. Hence, one would expect equally weighted sectors to outperform when concentration falls.

Exhibit 4 confirms this expectation: the S&P 500 Equal Weight Information Technology Index typically outperformed its float market-cap counterpart when the sector’s adjusted HHI declined. Hence, to the extent that current concentration levels decline, market participants may wish to consider the potential applications of an equally weighted sector strategy.

For more information on the interaction between concentration and equal weight performance, and to celebrate the S&P 500 Equal Weight Index’s 20th birthday, check out the replay of our Index Investment Strategy call from April 20, 2023.

The posts on this blog are opinions, not advice. Please read our Disclaimers.

Potential Applications of U.S. Equities for Asia-Based Investors

Contributor Image
Sherifa Issifu

Senior Analyst, U.S. Equity Indices

S&P Dow Jones Indices

Many investors have a so-called “home bias,” allocating to their domestic market in greater proportion than would be expected based on its representation in global equity markets. Asia-based investors are no exception. Here we present our U.S. equity icons as one potential way to provide diversification for Asian investors.

The breadth and depth of the U.S. equity market means that investors risk overlooking a significant chunk of the global equity opportunity set by under-allocating to U.S. equities, which may result in a large active share compared to a global benchmark. For example, Exhibit 1 shows that the U.S. was nearly three times larger than the entire investable Asian equity market, with smaller U.S. equity segments as large as entire local stock markets. The S&P 500® makes up nearly half of the pie, with the S&P MidCap 400®  and SmallCap 600® being larger than the Australian and Hong Kong stock markets, respectively.

Beyond U.S. equities representing a significant portion of the global opportunity set, their distinct sector weights may help investors to overcome domestic sector biases. Exhibit 2 shows GICS® sector weights of the S&P Pan Asia BMI and the relative weight compared to the S&P Global BMI and the S&P 500. The S&P Pan Asia BMI’s largest weights are in Financials (17%) and Information Technology (16%), with its smallest weight in the Energy sector, at 3%. Some key differences between the S&P Pan Asia BMI and S&P Global BMI and S&P 500 are that the global and U.S. benchmarks have a larger weight in Health Care and Information Technology and lower weights in Consumer Discretionary, Materials and Industrials.

The performance of U.S. equities may also motivate some to consider incorporating U.S. equities alongside domestic equities. Exhibit 3 shows the cumulative performance, in USD terms, of the S&P Pan Asia BMI versus U.S. equity indices since Dec. 30, 1994. The right-hand bar chart shows the annualized total returns of various single stock market indices against the S&P 500, S&P MidCap 400, S&P SmallCap 600 and DJIA®. Quite clearly, the U.S. equity indices outperformed, historically.

Exhibit 4 shows that the outperformance of U.S. equities was not driven by currency effects. Indeed, the S&P 500 outperformed single-market indices (as represented by the S&P Global BMI sub-indices) in local currency terms as well.

Exhibit 5a also shows the potential diversification benefit of incorporating U.S. equities: there was a non-perfect correlation with Asian equities over the last 28 years. Exhibit 5b also highlights that several single-market indices rank significantly lower in terms of correlation, with China having a 0.4 correlation to the U.S. since Dec. 30, 1994.

Unsurprisingly, perhaps, incorporating allocations to the S&P 500 could have improved risk-adjusted returns. For example, Exhibit 6 shows the annualized returns and volatility for various hypothetical combinations of the S&P 500 and the S&P Pan Asia BMI. These hypothetical combinations rebalance back to the target weights at each year end.

Portfolios that included some proportion of the S&P 500 posted higher returns than a 100% allocation to the S&P Pan Asia BMI.  The high returns were also achieved at a lower annualized risk.

Check out more research and insights on the S&P 500 and DJIA at https://www.spglobal.com/spdji/en/education/article/comparing-iconic-indices-the-sp-500-and-djia/ and https://www.spglobal.com/spdji/en/education/article/regional-relevancy-of-sp-500-and-dow-jones-industrial-average-futures-in-asia.

The posts on this blog are opinions, not advice. Please read our Disclaimers.

Exploring Two Decades of Fixed Income Innovation

Take a closer look at the latest SPIVA results as S&P DJI’s Brian Luke and BlackRock’s Stephen Laipply discuss how indexing works for fixed income, the iBoxx liquidity ecosystem, and what a growing range of passive tools could mean for yield seekers as income returns to fixed income.

The posts on this blog are opinions, not advice. Please read our Disclaimers.

The Same, Only Different

Contributor Image
Craig Lazzara

Former Managing Director, Index Investment Strategy

S&P Dow Jones Indices

In the first quarter of 2023, the best performing of the 17 factor indices featured in our monthly factor dashboard was S&P 500® High Beta (up 12.5%), while the worst performer was S&P 500 Momentum (-3.2%). This may seem odd at first blush, since both indices are, in some sense, performance chasers—Momentum in absolute and High Beta in relative terms. This admitted oversimplification ignores differences in rebalancing schedules, lookback periods, and risk adjustments, yet investors who wonder about the gap between the two indices’ performance are asking a reasonable question.

Exhibit 1 shows the relationship between the monthly returns of Momentum and High Beta. The historical correlation was an impressive 0.73, as the indices tend to rise and fall together.

This comparison, of course, ignores the impact of the market as a whole on the movements of both factors. Exhibit 2 corrects for this oversight by subtracting the return of the S&P 500 from those of both factor indices. The prior strong relationship evaporates, as the correlation of monthly excess returns is only -0.15. Net of the market’s impact, there is essentially no relationship between the returns of Momentum and High Beta.

In part, this stems from a subtlety in the construction of the two indices. High Beta seeks to measure the S&P 500’s highest-beta stocks. If the market has gone up, presumably the highest-beta stocks will be among the market’s best performers, and therefore might also be expected to turn up in Momentum. If the market has gone down, however, presumably the highest-beta stocks will be among the market’s worst performers, leading Momentum to tilt toward lower-beta constituents. This helps explain the specific differences observed during the first quarter of 2023, following the S&P 500’s 18% decline in 2022.

If this explanation is correct, it suggests a general pattern: when the market has risen, the performance of Momentum and High Beta might be similar; when the market has fallen, their performance is likely to diverge. To test this hypothesis, we formed deciles in our historical database, sorted by the trailing 12-month return of the S&P 500. For each decile, we computed the average subsequent 12-month absolute difference between the returns of Momentum and High Beta.

As Exhibit 3 shows, when S&P 500 performance was in its worst decile (with an average decline of 22.5%), the difference between Momentum and High Beta averaged 39.2%. In the second decile (with the S&P 500 down 2.8% on average), the difference falls to 17.6%. In the other eight deciles (where the S&P 500’s performance averaged 18.3%), the difference between Momentum and High Beta was a comparatively small 10%.

We’ve often written about the importance of the market environment in evaluating factor index performance and in considering factor combinations. It can be no less important in illuminating factor differences.

The posts on this blog are opinions, not advice. Please read our Disclaimers.

Global Islamic Indices Gained over 10% in Q1 2023, Outperforming Conventional Benchmarks

Contributor Image
Eduardo Olazabal

Associate Director, Global Exchange Indices

S&P Dow Jones Indices

Global equities ended the first quarter of the year with a gain of 6.9%, as measured by the S&P Global BMI. Meanwhile, Shariah-compliant benchmarks, including the S&P Global BMI Shariah and Dow Jones Islamic Market (DJIM) World Index, also increased during the quarter and outperformed their conventional counterparts by 3.5% and 3.4%, respectively.

Overall, regional broad-based Shariah and conventional equity benchmarks had a positive quarter, despite recent volatility in the banking industry. However, the Pan Arab region declined marginally by 0.5% in Q1, while its Shariah benchmark finished the quarter with an increase of 2.5%.

Drivers of Shariah Index Performance in Q1 2023

Shariah benchmarks outperformed their conventional counterparts during Q1, in contrast to prior quarter returns. Sector composition can provide some explanation for this quarter’s results. Higher exposure to Information Technology stocks within Islamic indices and having no exposure to conventional financial services, including banks, were the main drivers of this outperformance. The Information Technology sector was up 22.6% and represents 29.3% of the index’s weight, driving the highest return contribution among all sectors.

Meanwhile, other sectors experienced double-digit gains, such as Communication Services and Consumer Discretionary, which rose 24.6% and 14%, respectively, in Q1, contributing significantly to the index’s outperformance, despite having a relatively smaller weight compared to other sectors.

Energy and Utilities were the only sectors that decreased substantially during Q1, but the impact was limited by their small weight.

MENA Equities Post Mixed Results in Q1 2023

MENA equities experienced mixed results in Q1, with the regional S&P Pan Arab Composite was down 0.5%. GCC country performance was also mixed, with positive returns for Oman (5.0%), Bahrain (4.9%) and Saudi Arabia (1.6%), and losses in the UAE (-5.2%), Kuwait (-3.5%) and Qatar (-1%).

For more information on how Shariah-compliant benchmarks performed in Q1 2023, read our latest Shariah Scorecard https://www.spglobal.com/spdji/en/documents/performance-reports/scorecard-sp-shariah-djim.pdf


This article was first published in IFN Volume 20 Issue 15 dated April 12, 2023.


The posts on this blog are opinions, not advice. Please read our Disclaimers.