Get Indexology® Blog updates via email.

In This List

2023 GICS Changes: S&P Global 1200 Impact Analysis

A Dynamic Approach to Volatility Management

GICS Changes Are upon Us

Will the S&P GSCI Electric Vehicle Metals Outperform with Copper Leading the Way?

S&P U.S. Indices Year-End 2022: Analyzing Relative Returns to CRSP

2023 GICS Changes: S&P Global 1200 Impact Analysis

Contributor Image
Hector Huitzil

Analyst, Global Equity Indices

S&P Dow Jones Indices

Revisions to the Global Industry Classification Standard (GICS®) structure are primed to go into effect after the close of business on Friday, March 17, 2023. While the changes are not as extensive as in previous iterations, they affect the GICS structure at all levels and this article examines the impact of the changes on the S&P Global 1200.

Exhibit 1 shows the expected updates at the sector level for each index included in the S&P Global 1200. Inter-sector changes refers to reclassification of constituents to a different sector under the new GICS structure, while changes within sector refers to firms being reclassified (i.e. sub-industry updates) within their current sector.

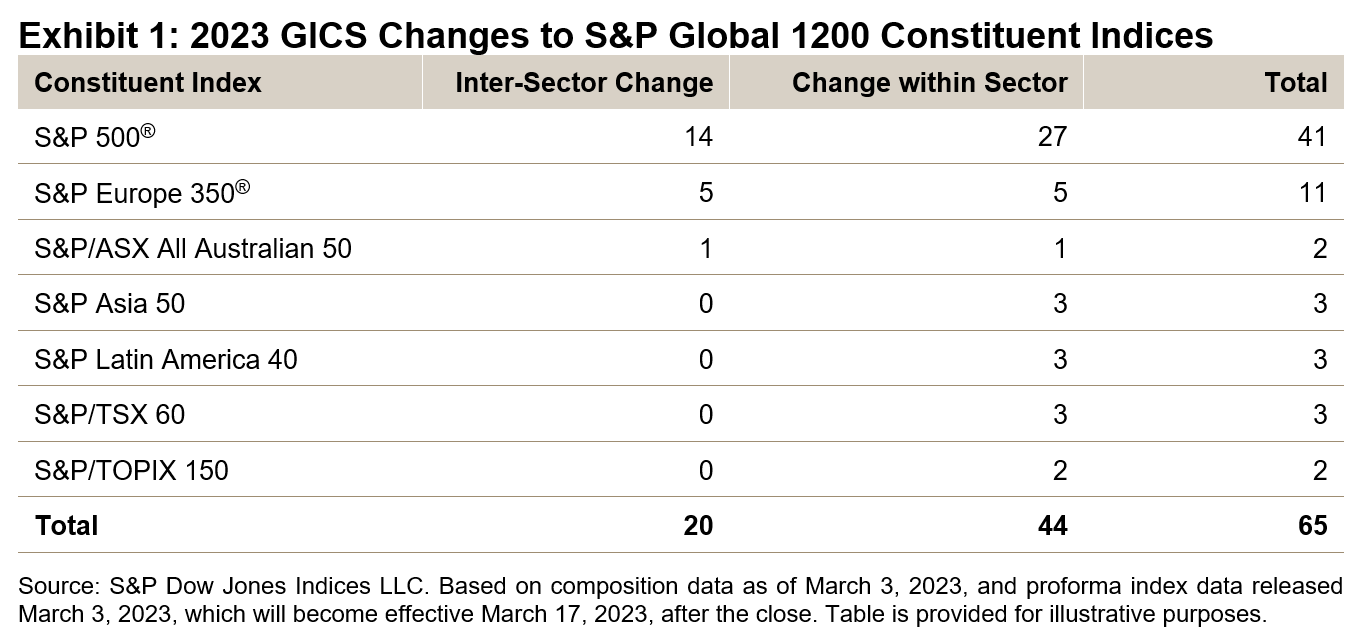
The S&P 500 is set to experience the greatest number of both inter-sector changes and changes within sector. More information can be found in the prior blog written by Fei Wang, 2023 GICS Changes: S&P 500 Impact Analysis.

Exhibits 2a and 2b examine modifications broken down at the sector level. Five out of the 11 GICS sectors will increase or decrease their constituent count, while four will experience intra-sector changes. Six sectors have been left untouched by the March 2023 GICS changes. The exhibit also incorporates any adds or drops stemming from index rebalancing that affect the overall sector compositions.

Inter-Sector Changes

The Information Technology (IT) sector will experience the largest decrease in constituents due to companies changing sector, while Financials will increase the most. Current IT sub-industry Data Processing & Outsourced Services will be discontinued, and current companies will either be re-classified to the new Transaction & Payment Processing Services sub-industry within the Financials sector or moved to the Industrials sector under a new Data Processing & Outsourced Services sub-industry.

The changes in the Consumer Discretionary sector are based on the nature of goods sold. Some retailers will be reclassified within the Consumer Staples sector. The discontinuation of the Internet & Direct Marketing retail, as well as the merger of the General Merchandise Stores and Department Stores into a new sub-industry called Broadline Retail, account for the majority of changes. Firms affected by these changes include Amazon, Alibaba and Prosus.

The Real Estate sector will be affected by an increased granularity of company classifications within Real Estate Investment Trusts (REITs). Retail properties, data centers, telecom towers and others will be reclassified at the sub-industry level.

Exhibit 3 analyzes the movement between sectors of the S&P Global 1200. On the left side are the current sectors of the impacted constituents, while the right side represent the destination following the GICS restructuring.

Breakdown of Changes by Country and Region

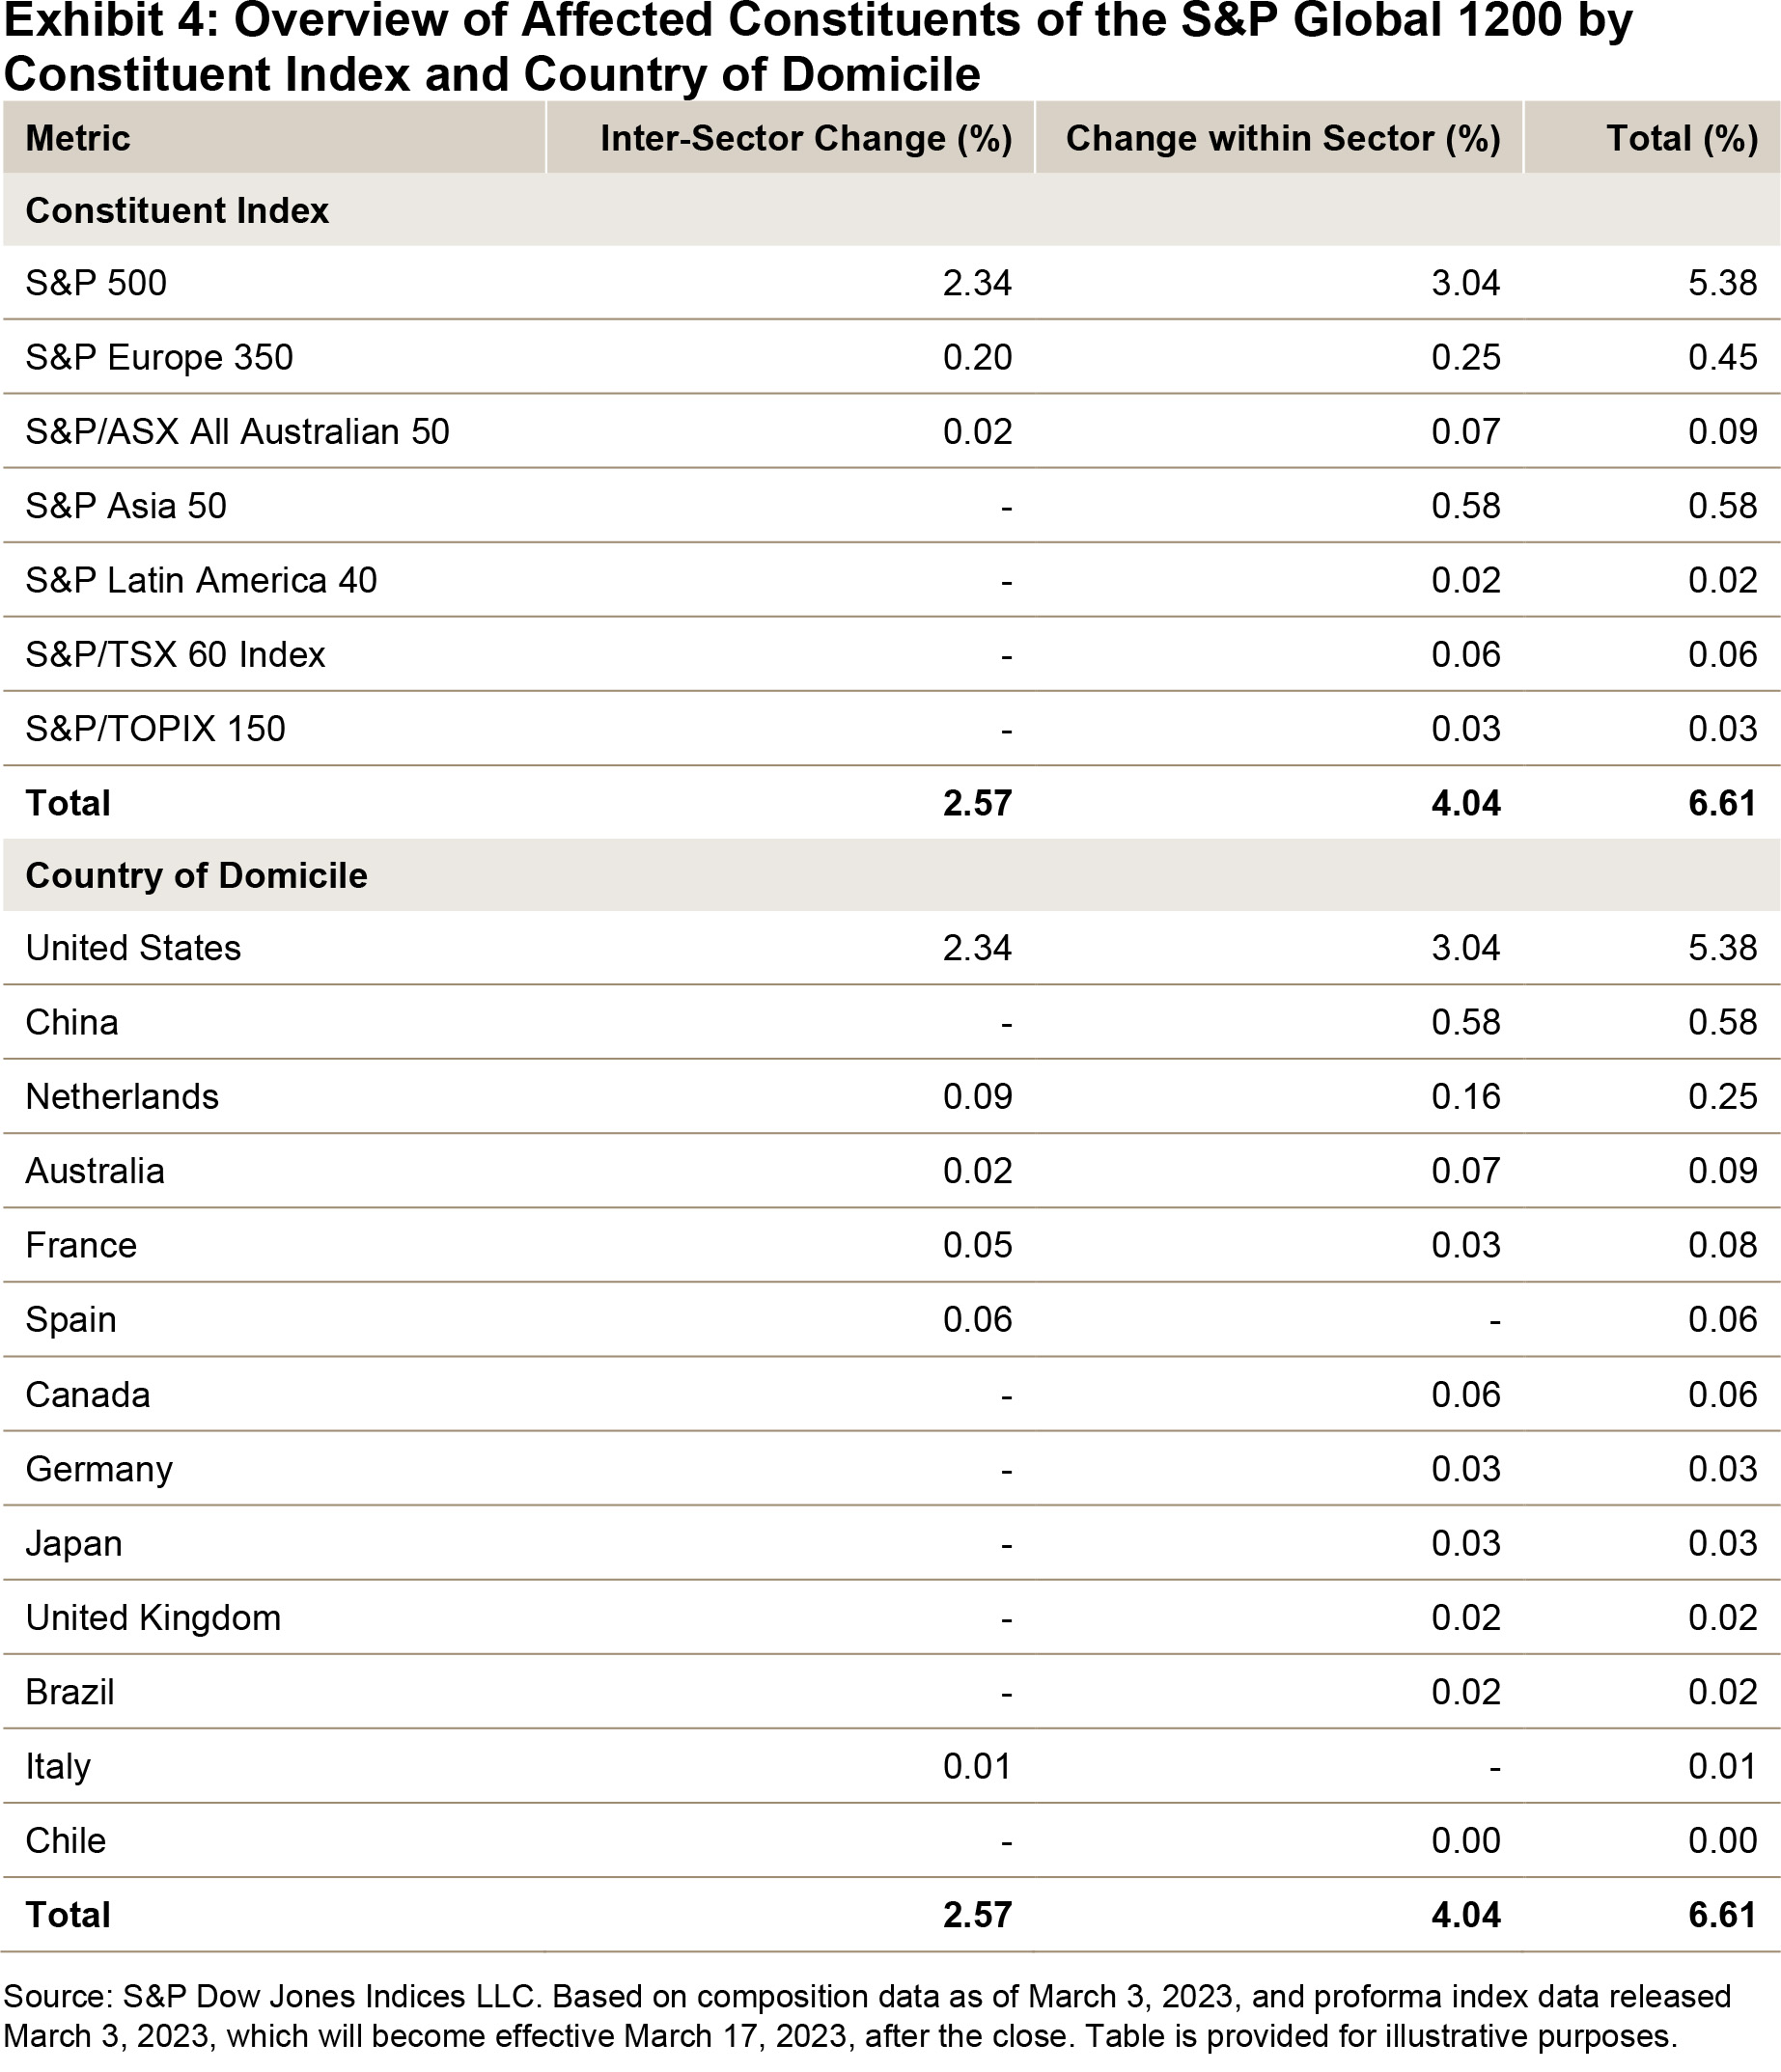
Exhibit 4 breaks down the changes by constituent index and country of domicile for the affected constituents, for both inter-sector and changes within sector.

Company-Level Changes

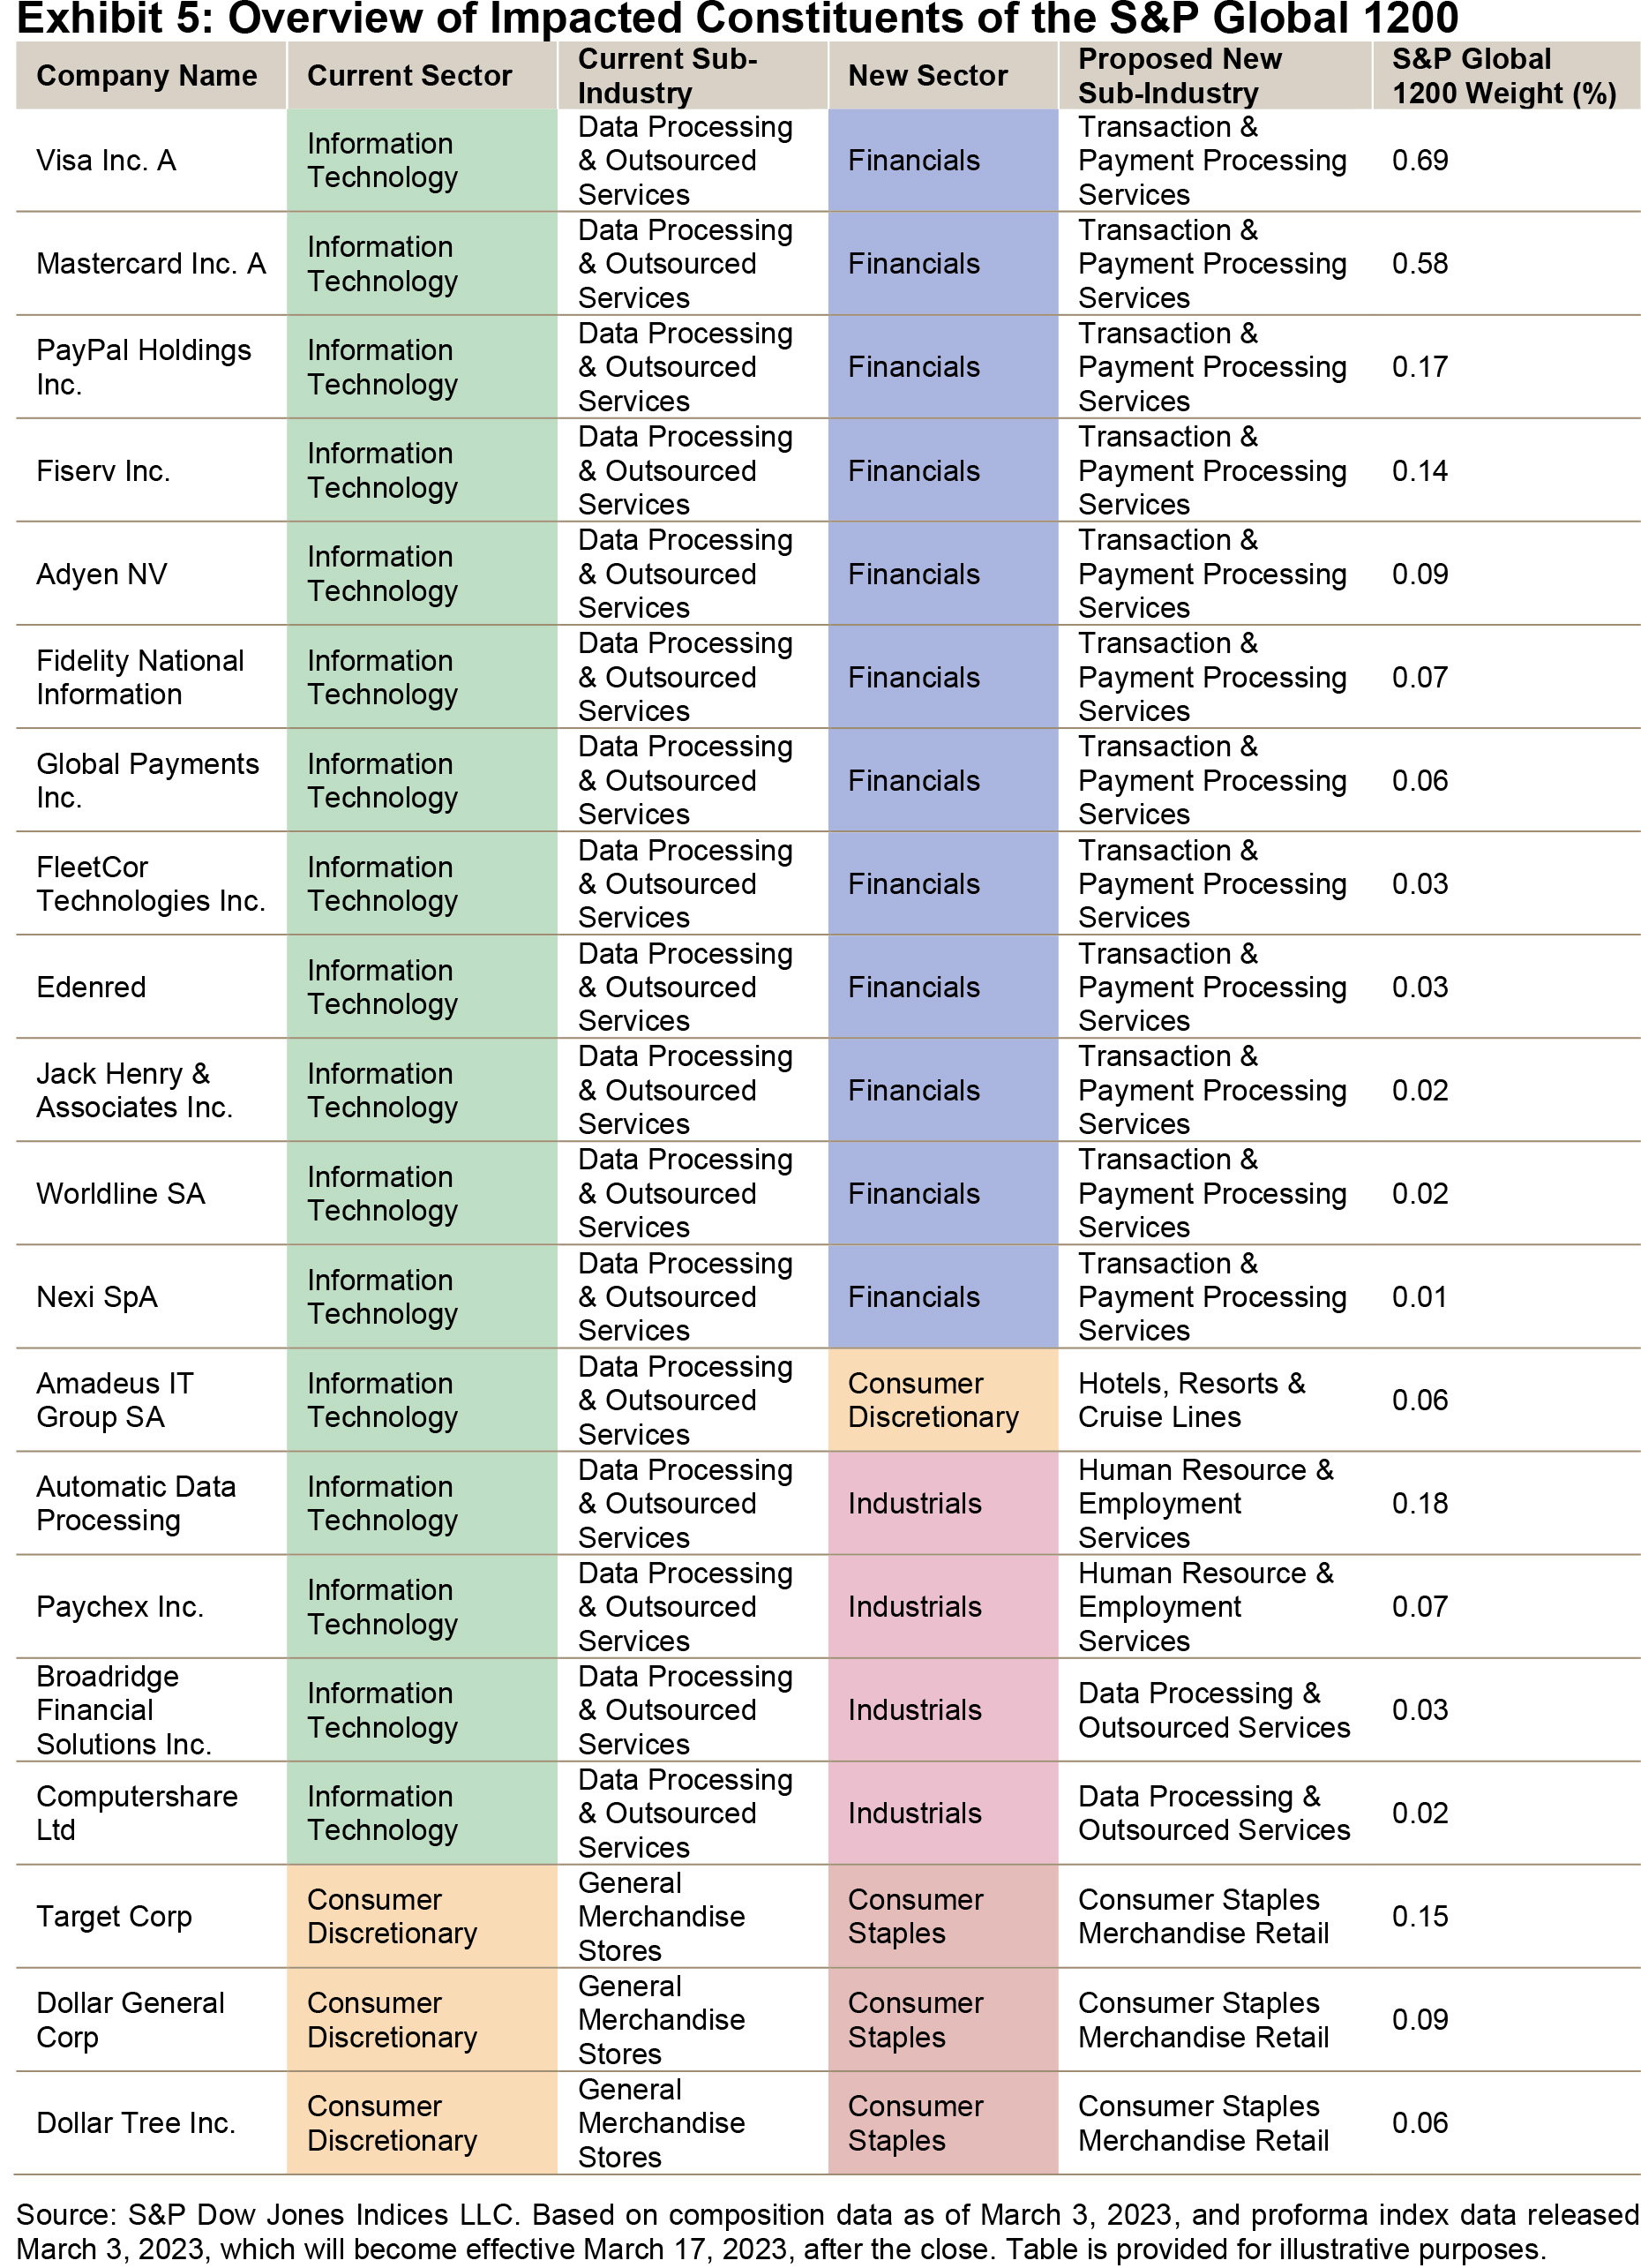
Visa and Mastercard represent the most significant inter-sector change, moving from Information Technology to Financials and entering as the third- and fourth-largest constituents in the sector by index market cap, respectively. Target leads the changes from the Consumer Discretionary sector, followed by Dollar General and Dollar Tree.

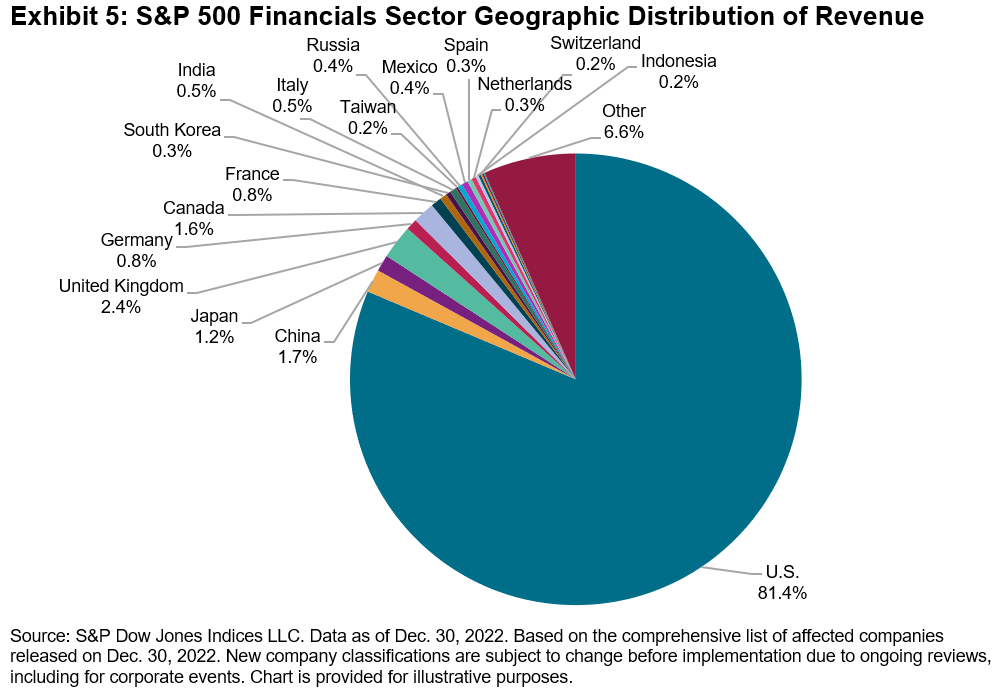
Exhibit 5 shows all companies affected by updates to sector definitions, along with their new assignments.


The posts on this blog are opinions, not advice. Please read our Disclaimers.

A Dynamic Approach to Volatility Management

How can indices seek to maintain a pre-defined level of implied volatility? Look inside the S&P 500 Futures Defined Volatility Indices, a dynamic, rules-based approach to volatility management helping market participants align investments with risk appetites systematically.

The posts on this blog are opinions, not advice. Please read our Disclaimers.

GICS Changes Are upon Us

Contributor Image
Elizabeth Bebb

Director, Factor & Dividend Indices

S&P Dow Jones Indices

As time passes, we draw ever closer to the date of the GICS® changes scheduled to take effect after the market close on March 17, 2023. There are five changes being implemented, some of which will move companies among sectors and others that will move companies within sectors.

Recent blogs have announced these changes: GICS changes are approaching considered the adjustments occurring in 6 of the 11 sectors and the resulting weights. The biggest changes will be a reduction in the Information Technology (IT) sector weight (-3.2%), with the balance heading to Financials (2.7%) and Industrials (0.5%). It also identified the changes in industry groups, industries and sub-industries.

A second blog (2023 GICS Change: S&P 500® Impact Analysis) dug deeper into the impact on the S&P 500. It highlighted the names of the 14 companies moving across sectors, a result of reclassifying certain companies to better reflect their underlying business activities.

This third blog aims to dig deeper still; does the moving of companies across sectors lead to a difference in the geographic diversification of revenues within sectors? We know that all the companies within the S&P 500 index are domiciled in the U.S., but their revenues are global in nature (See Exhibit 1 for a breakdown).

Utilizing the new sector classifications and the geographical revenue distribution of companies (derived from FactSet), we construct the geographical sales-weighted effect of the GICS changes across sectors.

The majority of sectors are unchanged. Exhibit 2 shows the distribution of revenues by geography for those sectors that are undergoing change.

The largest change in geographic revenues occurs within the U.S. for all sectors. This is as expected, as 69% of revenues in the S&P 500 come from the U.S. We note that the re-categorization of Data Processing and Revenue Outsourcing companies away from the IT sector led to an approximately 4% proportional revenue loss from the sector’s U.S. geography.

It’s also interesting to note that although Consumer Staples only has a 0.5% increase in weight, the impact to revenue from the U.S. for the sector is much greater, at 2.4%. Relocating the highly U.S.-focused businesses of Target, Dollar Tree and Dollar General from Consumer Discretionary to Consumer Staples has driven the latter sector to see a greater weight to the U.S. Finally, we noted small changes to the China and Taiwan revenue footprints for IT. This was a result of the reduction in overall U.S. revenues and reflective of where some of the largest markets for the sector are found.

Not all sectors are created equally. Exhibit 3 shows the percentage of U.S. revenues for all eleven sectors. We highlighted in red the five sectors that are affected by the upcoming GICS changes.

From a geographic revenue standpoint, IT is the most diversified sector, with only 44% of revenues driven by the U.S. This percentage will be reduced further due to the removal of Data Processing and Outsourced Services companies, which will move to either Financials or Industrials. This same change will increase the concentration of Financials in the U.S. from 80.3% to 81.4%.

To further illustrate the geographical spread among revenues and the impact of the GICS changes, the graphs below show the distribution of the Financials and IT sectors. IT is the most diverse sector, c. 44% of revenues are derived from the U.S. with China, Japan and Taiwan heavily represented in the geographical revenue distribution. The Financials sector is highly concentrated in the U.S. with the U.K., the next largest country, only providing around 2% of revenues.

Analyzing geographic revenues provides us with a complementary way to understand the upcoming GICS changes. While some companies are changing sectors within the S&P 500, the distribution of geographic revenues is not changing dramatically. The possible diversification benefits of U.S. equities via the S&P 500 remain.

For more information, please refer to our GICS changes pages here.


The posts on this blog are opinions, not advice. Please read our Disclaimers.

Will the S&P GSCI Electric Vehicle Metals Outperform with Copper Leading the Way?

Contributor Image
Jim Wiederhold

Former Director, Commodities and Real Assets

S&P Dow Jones Indices

Recent bullish fundamentals appear to be falling in line for the electric vehicle metals space. A decade of weak metals prices has led to underinvestment by miners and refiners, as private investment and bank financing support waned. In 2022, S&P Global released a comprehensive report on copper outlining the current trending Rocky Road supply scenario and a second scenario where everything goes right from a supply perspective to meet the forecasted quickly rising demand.1

Just-in-time inventory is not possible for metals. Years of exploration and planning is the only way to get a new mine online. There is no shortcut. Recent floods in Indonesia shut down operations at Grasberg, the world’s largest copper mine. This is just the latest in a string of extreme weather-related disruptions affecting the mining industry. Continued disruptions to metals supply could lead to increases in price.

Copper is the second-largest weight in the S&P GSCI Electric Vehicle Metals Index, due to its heavy use in wiring electronics. Gold and silver are the only two metals more conductive to electricity. Copper is almost equivalent to silver in conductivity. Within the theme of electrification, copper is the most important metal when considering all renewable energy applications.

While certain metals tend to be highly pollutive to produce, metals overall will play a key role in the energy transition. Our newly launched S&P GSCI Climate Aware saw the biggest increase in weight in copper at the expense of crude oil compared to the S&P GSCI benchmark. Copper is currently the highest weight in the index at 18%. Crude oil’s overall greenhouse gas emissions led to the biggest drop, while copper is one of the least pollutive metals to produce today.

Forecasts for higher demand of metals are expected to increase over time as the electric vehicle (EV) market continues to expand. One way of reducing our reliance on fossil fuels is by switching from internal combustion engines to electric vehicles. Industrial and battery metals will be needed in far greater quantities than are currently being produced and the mix of metals will likely shift over time. We don’t know which battery chemistry will win long-term, as new batteries are tested to try to meet the demands of lower cost and extended EV range.2

Cobalt and lithium will play a crucial role, but newer battery chemistries heavier in nickel and iron ore are being tested and could win out in the long term. The S&P GSCI Electric Vehicle Metals Index is designed to adjust over time as the overall EV metals market adjusts with the changing world. S&P Global Commodities Insights conducts a biyearly research-based check-in on the EV market to determine the current mix and weights of the metals making up the average EV.

The underlying industrial metals will be critical, and prices tend to be correlated to PMI readings around the world. Economic sentiment affects metals prices over the long term. If we are headed toward a prolonged recession, this could be a key risk in the short term against the case for higher-trending metals prices.


1 S&P Global, “The Future of Copper: Will the looming supply gap short-circuit the energy transition?” 2022.

2 Lazzaro, Nick. “World copper deficit could hit record; demand seen doubling by 2035.” S&P Global. July 14, 2022.

The posts on this blog are opinions, not advice. Please read our Disclaimers.

S&P U.S. Indices Year-End 2022: Analyzing Relative Returns to CRSP

Contributor Image
Cristopher Anguiano

Senior Analyst, U.S. Equity Indices

S&P Dow Jones Indices

The S&P U.S. Equity Indices aim to represent and measure the performance of distinct market cap segments of the investable U.S. equity market. The S&P Composite 1500®, which consists of the S&P 500®, S&P MidCap 400® and S&P SmallCap 600®, is constructed differently compared to other indices with similar objectives. These nuances can impact index characteristics and help to explain differences in performance.

Exhibit 1 shows the performance of these indices against their CRSP counterparts. S&P U.S. Equity Indices typically outperformed over distinct time horizons, and they outperformed across the cap spectrum in 2022, continuing the positive mid-year trend.

In 2022, the mid- and mid/small-cap segment showed the strongest outperformance numbers: the S&P MidCap 400 and S&P 1000 indices outperformed their CRSP counterparts by 5.62% and 4.26%, respectively, the second-largest calendar year outperformance figures since 2016. Differences in sector exposures were useful in explaining relative returns last year.

For example, Exhibit 2 shows the attribution analysis of the S&P MidCap 400 against the CRSP U.S. Mid Cap Index. The analysis assesses the portion of S&P 400® relative returns in 2022 that came from differences in GICS® sector exposures (allocation effect) versus the choice of companies in each sector (selection effect). A key takeaway from Exhibit 2 is that while the S&P 400 benefited from having less exposure to IT, which underperformed, the choice of companies in the sector (selection effect) had an even greater impact. Similar results were observed across the cap spectrum in 2022.

The S&P U.S. Core Indices’ 2022 outperformance drove the S&P U.S. Growth Indices’ relative returns versus CRSP growth indices. Exhibit 3 shows that the S&P U.S. Growth Indices outperformed their CRSP growth counterparts across the market cap spectrum, with the S&P MidCap 400 Growth (9.9%) and S&P 1000 Growth (9.6%) indices recording their second-largest outperformance rates since 2016. S&P U.S. Value Indices generally underperformed, although the S&P MidCap 400 Value slightly outperformed the CRSP U.S. Mid Cap Value Index, by 0.9%.

Performance attribution analysis shows that the allocation and selection effects in 2022 were positive for the S&P U.S. Growth Indices (see Exhibit 4). The S&P Growth Indices benefited from less exposures to sectors like IT and more to Energy, as well as the choice of constituents in Financials and IT. The opposite was true for S&P Value Indices, which were particularly hindered by having less exposure to some of the best-performing sectors like Energy. Although sector exposures were a drag, the choice of companies in some sectors like Financials and Consumer Discretionary helped to mitigate some of the negative performance.

Despite a challenging 2022 for the U.S. equity market, S&P U.S. Core Indices outperformed CRSP core indices. Differences in index construction that determine sector exposures and selection of companies were helpful in explaining relative returns. Similarly, S&P Style Indices’ relative returns versus their CRSP counterparts also highlighted that index construction matters. Indices with similar objectives can behave differently, especially over shorter time periods.

The posts on this blog are opinions, not advice. Please read our Disclaimers.