Get Indexology® Blog updates via email.

In This List

Good Things Come in Threes: Muni Bonds Appear Ripe for 2023

Record CDS Index Volumes As We Head into the 20-Year Anniversary of iTraxx and CDX

2023 GICS Changes: S&P 500 Impact Analysis

18-Year Performance of the S&P/ASX BuyWrite Index

Commodities Flat in January After Second-Best Yearly Performance in Two Decades

Good Things Come in Threes: Muni Bonds Appear Ripe for 2023

Contributor Image
Brian Luke

Senior Director, Head of Commodities, Real & Digital Assets

S&P Dow Jones Indices

With one month down in 2023, let’s track the performance of municipal bonds so far: as of Jan. 31, 2023, the yield for the S&P National AMT-Free Municipal Bond Index was at roughly 3% (3.02% to be exact). The total return was up about 3% for January (2.87% to be exact), putting a dent in last year’s sell-off to provide a one-year return of “only” -3% (-2.97%). With rates rising, new opportunities are being uncovered and investors are seeking new ways to access the municipal bond market.

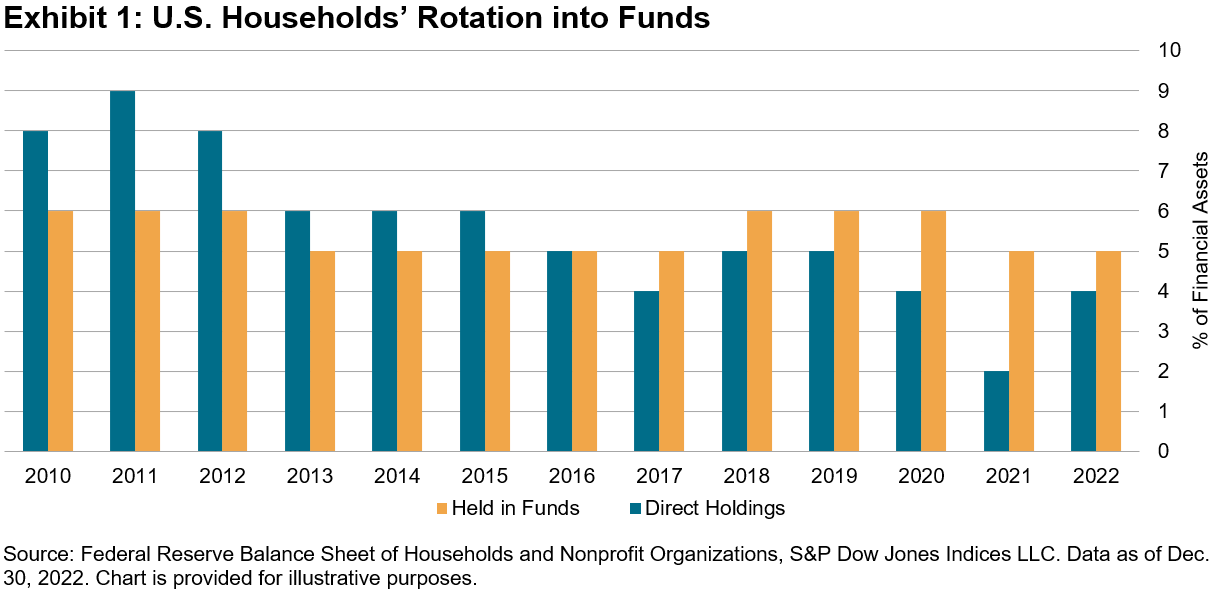
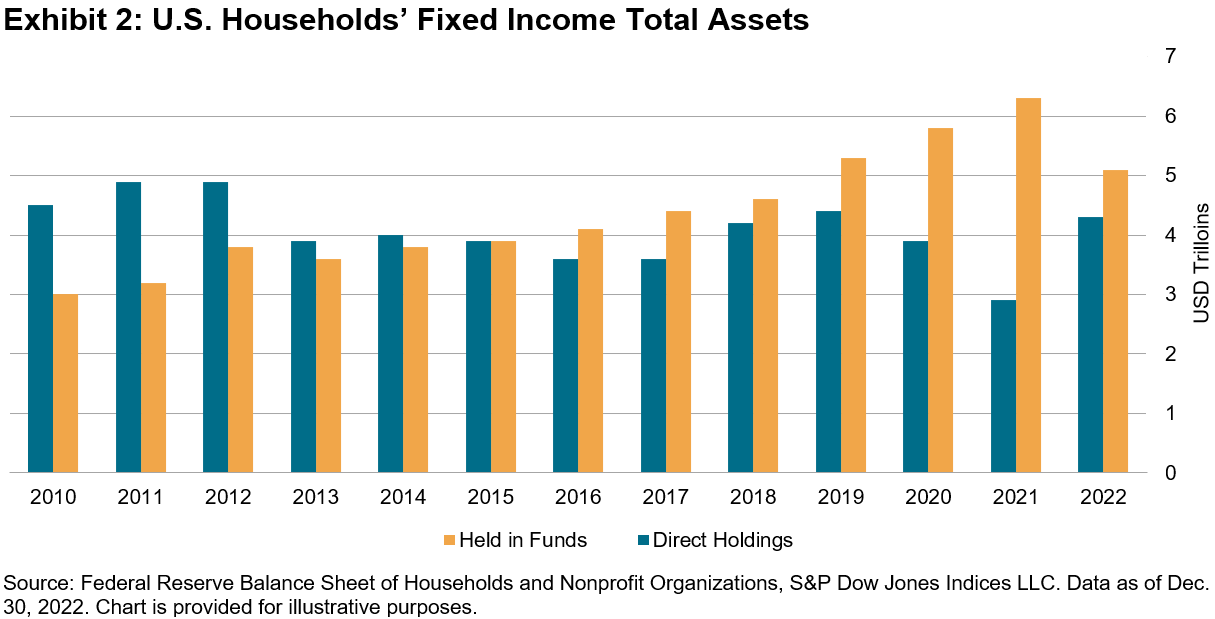
Increasingly, investors are looking for income through index-tracking funds. In January alone, more than USD 25 billion flowed into U.S.-listed fixed income ETFs. While large institutions have traditionally allocated to bonds, retail investors have changed how they allocate to fixed income, with an increasing preference for funds. Focusing on U.S. households, both the share (see Exhibit 1) and total value of assets held in fixed income funds (see Exhibit 2) are larger than individual bond purchases. As a larger percentage of the population enters retirement age, the need for a fixed stream of income would appear to be greater. Federal Reserve data has shown that this has not been the case. Baby Boomers started to enter retirement age in the last decade and are expected to continue through this decade. During that time, U.S. households’ total share of fixed income (both direct bond purchases and purchases through funds) shrank. This contrasts with the equity market, where the total share of equities held has risen from 28% to 35% since 2010.

Over the past five years, individual investors have shown an increasing preference for accessing the bond market through index-tracking ETFs. When comparing fund flows of mutual funds and ETFs, a stark contrast emerged in 2022. Fixed income mutual funds had USD 546 billion in outflows in 2022 due to rising rates and price underperformance. Despite that market backdrop, fixed income ETFs saw USD 199 billion in inflows. This trend also played out in the municipal market. While taxable bond ETF asset flows kept AUM levels relatively flat, municipal bond flows grew by USD 29 billion, pushing municipal bond ETFs assets to over USD 100 billion, a 26% increase

One possible reason for the rising popularity of fixed income ETFs could be investor preference for index-based products with increased transparency and liquidity. Another reason could be the ease of access and low cost. Evidence that retail transaction costs to trade municipal bonds can be as much as 66 bps more than institutional trades provides a good reason for this one-sided flow.1 Transaction costs could potentially be reduced by accessing bonds through mutual funds or ETFs. These ETFs have a distinct advantage in that shares of the fund can be exchanged without the need to incur any transactions in the institutional market.

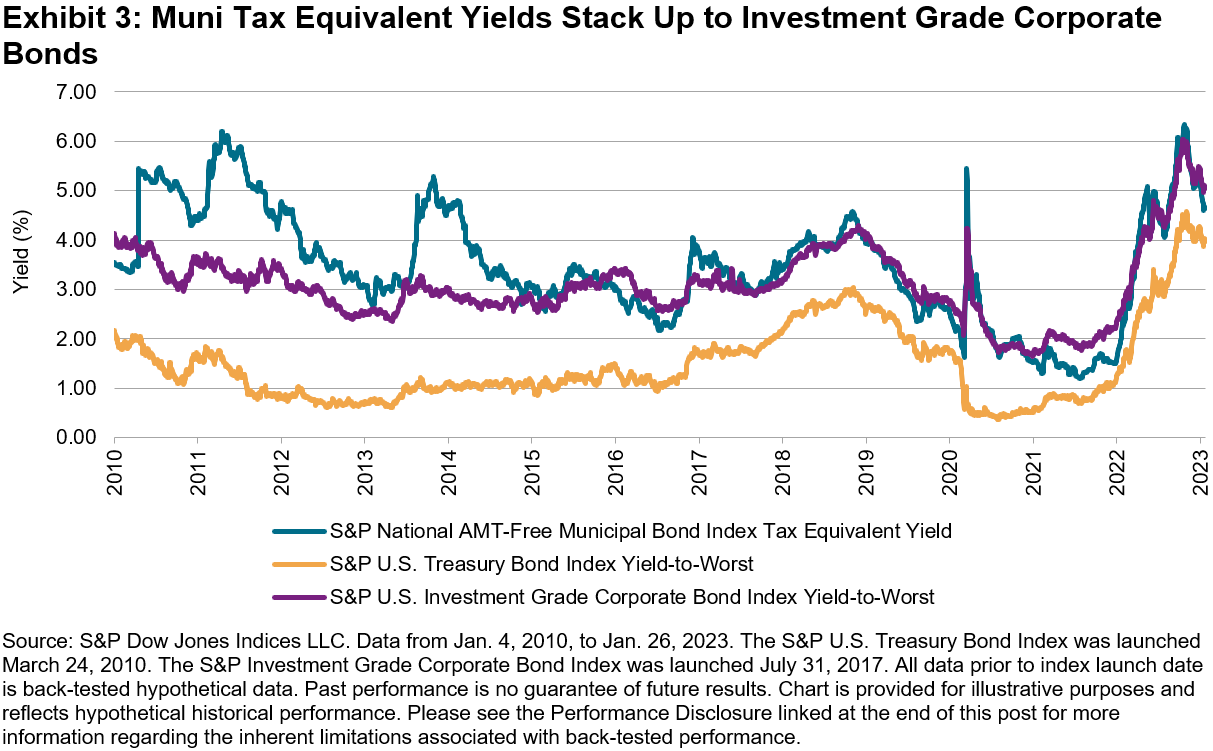
The current tax equivalent yield on the S&P National AMT-Free Municipal Bond Index is 4.63%. Taking tax benefits into account puts municipal bonds on equal footing with other taxable fixed income sectors like treasuries and corporate bonds. U.S. Treasury yields fall short of that, at 4%, while corporate bonds currently exceed 5% (see Exhibit 3). Those incremental 37 bps do come with credit risk, however, as the average rating for the municipal index is AA, compared with A- for the corporate index.

Rising yields have drawn increased attention to the bond market. As investors readjust to a world where fixed income could actually offer income, they face an unprecedented array of ways to access targeted exposures to states and duration. More than ever before, municipal bond investors are choosing index-based products, making their preferences clear and changing the fund landscape. With hundreds of municipal bond indices tracking the broad market, you can measure the national market, drill down to state-level performance and seek out targeted interest rate exposures down to a single maturity year.

1 Giordano, Jason. “The Hidden Costs of Retail Purchases in Municipal Bonds.” S&P Dow Jones Indices LLC. July 2022.

The posts on this blog are opinions, not advice. Please read our Disclaimers.

Record CDS Index Volumes As We Head into the 20-Year Anniversary of iTraxx and CDX

Contributor Image
Srichandra Masabathula

Associate Director, Fixed Income Products

S&P Dow Jones Indices

This blog was co-authored by Srichandra Masabathula and Nicholas Godec

In 2022, volumes in CDX and iTraxx reached an all-time high of nearly USD 36 trillion—a 43% year-over-year increase. Such record-breaking volumes occurred as we fast approach the 20-year anniversary of the indices—CDX and iTraxx will roll into Series 40 in March and September 2023, respectively. Two decades later, the CDS indices continue to evolve with changing markets and provide the most liquid means for institutional investors to gain or hedge credit exposure. The last three years have been some of the most volatile in recent history—they have also successively set record volumes for CDS indices. When markets were volatile and fixed income liquidity became sparse, the liquidity of the CDS indices remained.

From a notional outstanding perspective, CDS exposure from the iTraxx and CDX indices has continued to climb (see Exhibit 2). Currently, there is over USD 7.5 trillion of notional outstanding in iTraxx and CDX, up from about USD 6.8 trillion at the end of 2021. The magnitude of outstanding notional points to the structural importance of the CDS indices to the global credit markets.

There’s also been a consistent increase in the share of overall CDS exposure that is linked to iTraxx and CDX products. As of year-end 2022, over 70% of all CDS gross notional oustanding was linked to iTraxx and CDX indices, including tranches and swaptions (see Exhibit 3).

At nearly 20 years old, with varied market participants and trillions in volumes and outstanding exposure, one might deem CDX and iTraxx to be mature. However, maturity often connotes the end of growth, which would be incorrect. Rather, the CDS indices are coming of age and continue to grow and change to reflect the needs of the market participants they serve. The indices may be getting older—but they’ve no signs of slowing down.


The posts on this blog are opinions, not advice. Please read our Disclaimers.

2023 GICS Changes: S&P 500 Impact Analysis

Contributor Image
Fei Wang

Senior Analyst, U.S. Equity Indices

S&P Dow Jones Indices

GICS® changes are approaching. On Dec. 15, 2022, S&P Dow Jones Indices and MSCI jointly announced a full list of companies affected by the upcoming revisions to the Global Industry Classification Standard (GICS) structure. Although the 2023 GICS changes are not as extensive as the Communication Services sector change in 2018, there are still significant impacts to many sectors, industries and companies.

Exhibit 1 shows an overview of the expected impact on various U.S. equity indices. The “intra” changes refer to the reclassification of stocks within a sector, while the “inter” changes correspond to stocks being moved from their current sector to another under the new GICS structure. These U.S. equity indices have more intra than inter changes in this reorganization.

Exhibit 2 provides more detail on the S&P 500, showing that 6 of the 11 S&P 500 sectors will be affected by the upcoming GICS changes. Real Estate accounts for the vast majority of intra changes, reflecting the sector’s additional granularity in the upcoming restructuring. Hence, 17 stocks will be reclassified within the Real Estate sector, making up 60% of the sector market weight post-changes. Most changes will come from the current Specialized REITs and Residential REITs categories, which will be placed into more specific categories.

Exhibit 3 demonstrates how the impacted stocks are set to move between sectors. The current GICS sector is on the vertical axis, and the GICS sectors under the new structure on the horizontal axis. The boxes on the diagonal represent intra changes. For example, out of the 11 stocks leaving the Information Technology sector, three of them are moving into the Industrials sector and eight into the Financials sector.

The key driver behind the inter changes of the Information Technology sector is the discontinuation of the Data Processing & Outsourced Services sub-industry. Companies will be reclassified to Financials and Industrials sectors to better align with their business support activities. For instance, all eight stocks that are set to join the Financials sector— including Visa and Mastercard—will be classified under the newly created Transaction and Payment Processing sub-industry. Likewise, all three stocks joining the Industrials sector will go to the Human Resources & Employment Services sub-industry with its updated definition.

Changes to the Consumer Discretionary and Consumer Staples sectors indicate that retailers will be classified based on the nature of goods sold. For instance, Amazon, being the largest affected stock in the S&P 500, will be reclassified within the Consumer Discretionary sector, from a discontinued Internet & Direct Marketing Retail sub-industry to a newly created Broadline Retail sub-industry.

Exhibit 4 shows how the upcoming GICS changes are set to affect the largest 10 stocks in the impacted sectors, based on the data as of Dec. 30, 2022. Target Corp will move from Consumer Discretionary to Consumer Staples, displacing Estee Lauder from the largest 10 corporations in the Consumer Staples sector, while Visa and Mastercard will move from Information Technology to Financials.

Other than the major changes described above, the March GICS changes also include updates to Transportation, Banks and Thrifts & Mortgage Finance, which are more prevalent in smaller caps. The analysis on the flagship S&P 500 shows how other U.S. equity indices can be similarly assessed by the upcoming GICS changes.

The posts on this blog are opinions, not advice. Please read our Disclaimers.

18-Year Performance of the S&P/ASX BuyWrite Index

Contributor Image
Maxime Fouilleron

Analyst, Multi-Asset Indices

S&P Dow Jones Indices

The volatile and unpredictable nature of the stock market is characterized by periods of ups and downs. Covered call option writing is a strategy aimed at generating income and mitigating loss, particularly in bear market environments. A covered call (or “buy-write”) strategy involves selling a call option against an asset that is already owned by the option writer. If the asset’s market price exceeds the strike price of the contract, a rational call option buyer would exercise the option. This would then obligate the asset owner to sell the asset at the strike price to the option buyer. If the strike price is not met, the owner maintains possession of the asset. In either case, the asset owner keeps the profits from selling the call contract—known as the “option premium.”

One factor that influences the premium received from selling a call is the “option moneyness;” that is whether the option contract is “in the money” (ITM), “out of the money” (OTM), or “at the money” (ATM). An OTM call has a strike price that is above the current market price. An ATM call has a strike price that is equal to the current market price of the asset—this generates a higher premium, as there is a greater chance that the option will be exercised at this price.

A major drawback of the covered call strategy occurs if a call option is “in the money” and the buyer exercises their option to purchase the underlying asset at the below-market strike price. The option writer would miss out on any gains that the asset may achieve beyond the strike, as they will be forced to sell the asset at this lower price, therefore capping the asset’s growth potential (see Exhibit 1). A long-term covered call strategy can help make up for this by offering consistent income that can be used to reinvest into the asset.

The S&P/ASX BuyWrite Index was launched in May 2004. It employs a covered call methodology in which the index holds a long position on the underlying S&P/ASX 200 while selling quarterly at-the-money calls on this position.

The S&P/ASX BuyWrite Index seeks to track the equity assets of the underlying index and the dividends they provide, while also generating additional income from accumulated option premiums. These premiums are reinvested into the long equity position. This has enabled the buy-write index to outperform the underlying equity index historically in a down, neutral or moderately up market (see Exhibits 2 and 3). In turn, the index has underperformed the underlying equity index during periods of strong rallies due to its capped upside potential (see Exhibit 4). Long-term live performance of the S&P/ASX BuyWrite Index is competitive with that of the S&P/ASX 200 (see Exhibit 5). The consistent reinvestment of option premiums has historically helped reduce the volatility of the covered call index compared to its underlying index (see Exhibit 5).


In the next blog, we will dig into the income-generating feature of this index. Stay tuned!

The posts on this blog are opinions, not advice. Please read our Disclaimers.

Commodities Flat in January After Second-Best Yearly Performance in Two Decades

Contributor Image
Jim Wiederhold

Former Director, Commodities and Real Assets

S&P Dow Jones Indices

The 24 individual commodities comprising the S&P GSCI finished the first month of 2023 with divergent performance. This echoed the uncertain path forward regarding inflation expectations. Half outperformed, with industrial metals leading the way, while the other half declined, with natural gas tanking, as European countries filled their tanks to their brims. Gold had one of its best starts to a year in a decade, while the agriculture and livestock sectors finished near flat for the month, which masked the volatility of the underlying commodities.

Market participants started 2023 by reversing some of the price action in key industrial metals. The S&P GSCI Zinc outperformed by 14.59%, as the London Metal Exchange (LME) metal inventory plunged to the lowest level since 1989. This was slightly offset by rising zinc inventories in China. The S&P GSCI Aluminum and S&P GSCI Copper rose by 11.34% and 10.45%, respectively, on the back of recent expectations of a soft landing globally. These three metals posted their best start to a year in over 30 years. The S&P GSCI Nickel cooled off after posting one if its best yearly performances in 2022. Industrial metals are considered the most crucial inputs to our future economy, with demand expected to pick up rapidly, while supply may be constrained over the next decade. China’s reopening from strict COVID-19 lockdown restrictions also contributed to the bullish price action in the sector.

The major news in the energy complex was the S&P GSCI Natural Gas dropping 34.22% in January due to a small glut of inventory, as Europe filled its tanks well above expectations. This coincided with a surprisingly warmer winter so far in the region, abating fears of undersupply after cutting off Russian imports. The petroleum complex finished flat, despite investors pilling back into petroleum futures and options at the fastest rate in more than two years.

The S&P GSCI Gold rose 6.02% in January, as the U.S. dollar continued its steady decline below 2022 highs. A demand for real assets and one of the strongest recent readings of global central bank purchases of the precious metal led market participants to position bullishly in gold. As a store of value in times of asset price decline, gold has historically performed well when other stores of value have deteriorated. In prior times of high and rising inflation, gold tended to lag other inflation-sensitive assets, and this time it seems to be no different.

The S&P GSCI Agriculture finished the month up 1.18%, with softs outperforming, while only wheat lagged. While wheat prices have dropped in the U.S., they rose to a multi-year high in India due to continued tight supply, as the harvest shrunk due to severe heat waves and higher export demand amid the Russia-Ukraine conflict.

Within the S&P GSCI Livestock sector, lean hogs underperformed dramatically, down . Similar to other commodity starts this year, this was a reversal from last year’s performance.

The posts on this blog are opinions, not advice. Please read our Disclaimers.