Get Indexology® Blog updates via email.

In This List

18-Year Performance of the S&P/ASX BuyWrite Index

Commodities Flat in January After Second-Best Yearly Performance in Two Decades

Examining the Dividend Risk Premium

Net-Zero Targets and Temperature Alignment: Two Sides of the Same Coin?

What Performance Reversals Suggest

18-Year Performance of the S&P/ASX BuyWrite Index

Contributor Image
Maxime Fouilleron

Analyst, Multi-Asset Indices

S&P Dow Jones Indices

The volatile and unpredictable nature of the stock market is characterized by periods of ups and downs. Covered call option writing is a strategy aimed at generating income and mitigating loss, particularly in bear market environments. A covered call (or “buy-write”) strategy involves selling a call option against an asset that is already owned by the option writer. If the asset’s market price exceeds the strike price of the contract, a rational call option buyer would exercise the option. This would then obligate the asset owner to sell the asset at the strike price to the option buyer. If the strike price is not met, the owner maintains possession of the asset. In either case, the asset owner keeps the profits from selling the call contract—known as the “option premium.”

One factor that influences the premium received from selling a call is the “option moneyness;” that is whether the option contract is “in the money” (ITM), “out of the money” (OTM), or “at the money” (ATM). An OTM call has a strike price that is above the current market price. An ATM call has a strike price that is equal to the current market price of the asset—this generates a higher premium, as there is a greater chance that the option will be exercised at this price.

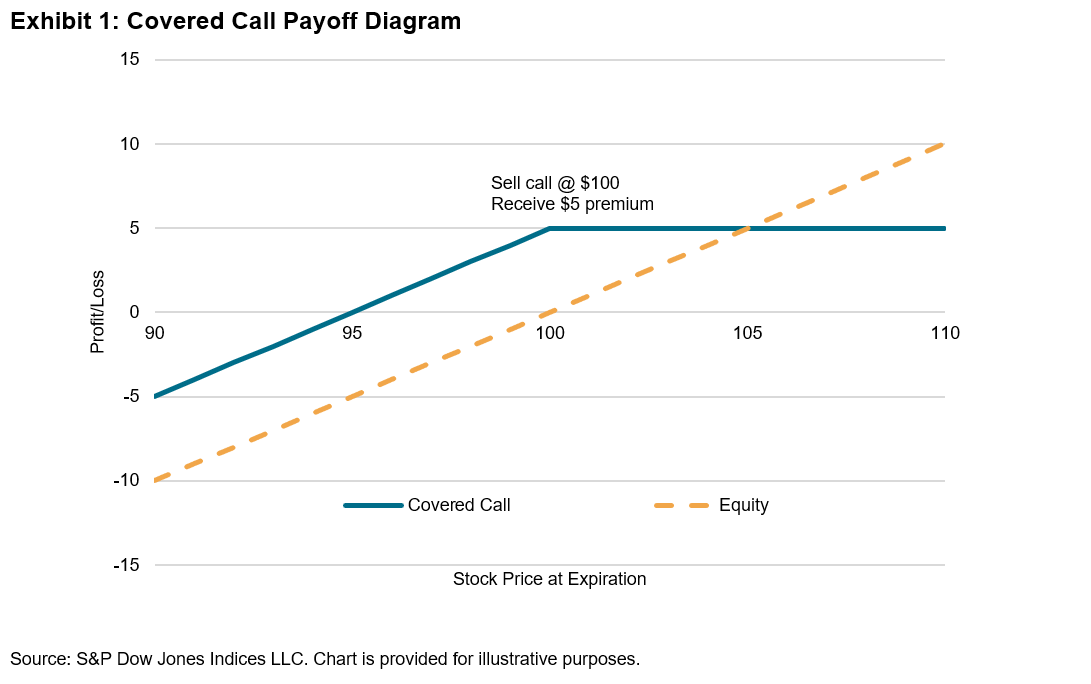
A major drawback of the covered call strategy occurs if a call option is “in the money” and the buyer exercises their option to purchase the underlying asset at the below-market strike price. The option writer would miss out on any gains that the asset may achieve beyond the strike, as they will be forced to sell the asset at this lower price, therefore capping the asset’s growth potential (see Exhibit 1). A long-term covered call strategy can help make up for this by offering consistent income that can be used to reinvest into the asset.

The S&P/ASX BuyWrite Index was launched in May 2004. It employs a covered call methodology in which the index holds a long position on the underlying S&P/ASX 200 while selling quarterly at-the-money calls on this position.

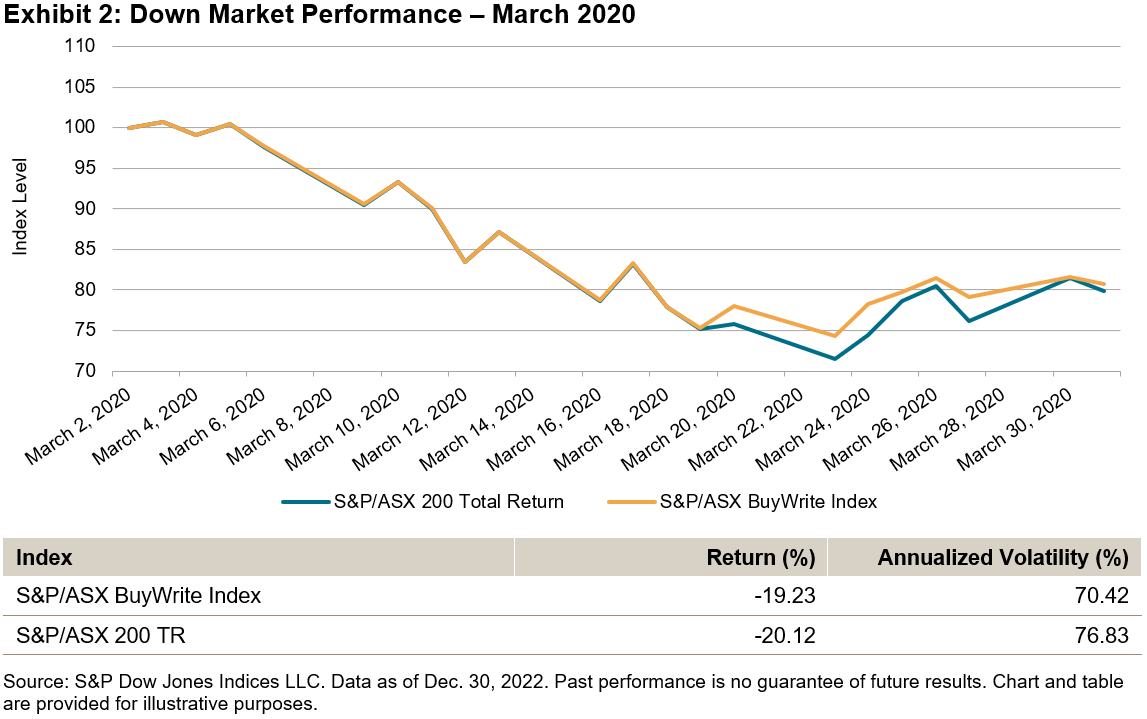
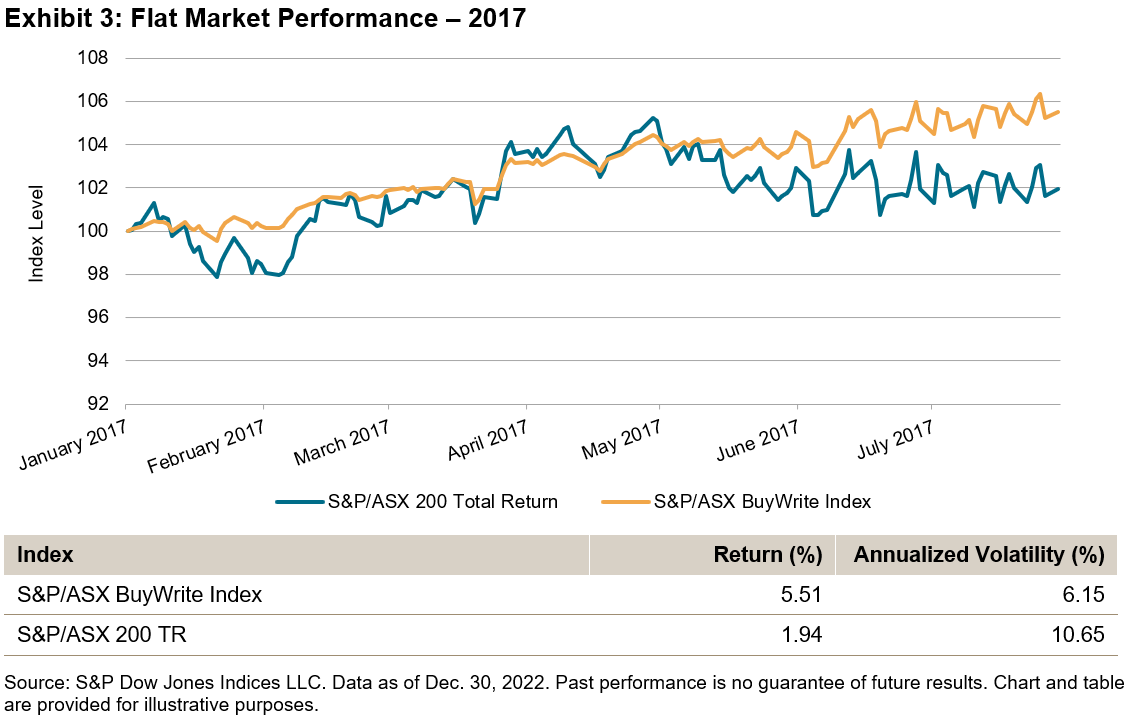
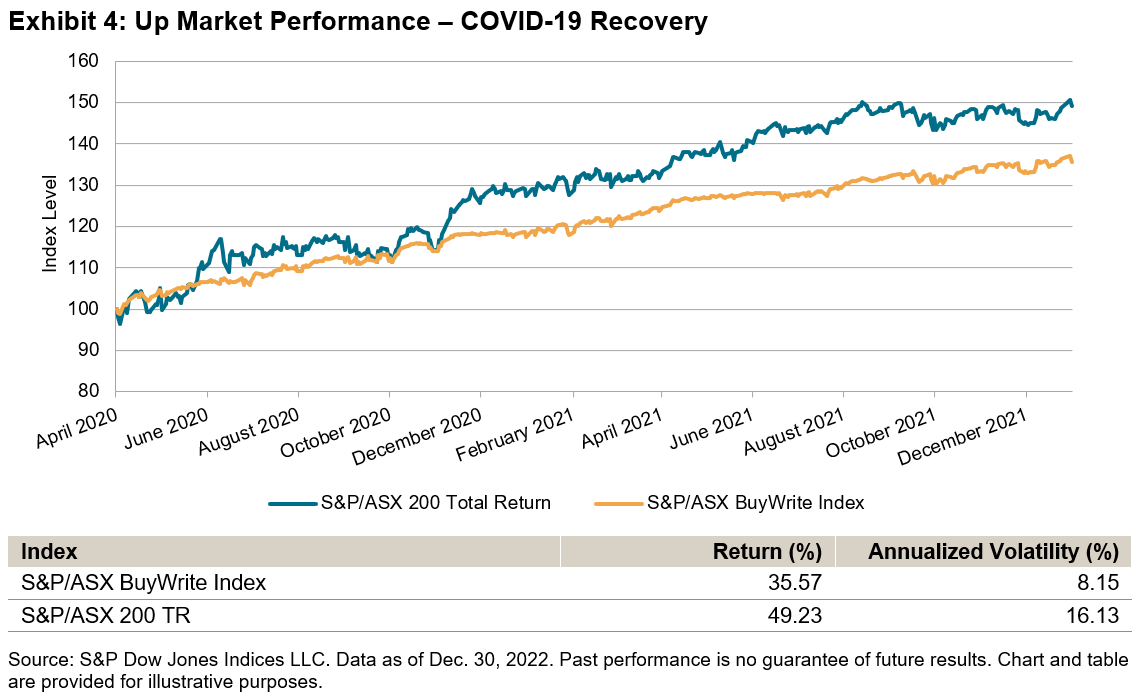
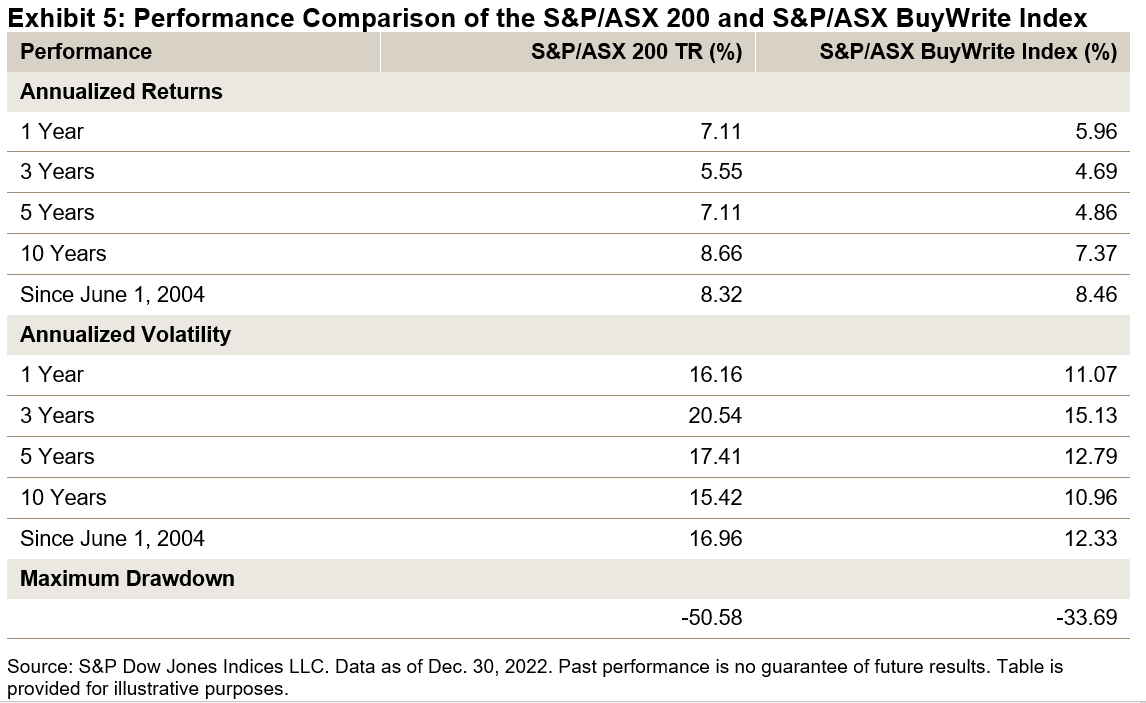
The S&P/ASX BuyWrite Index seeks to track the equity assets of the underlying index and the dividends they provide, while also generating additional income from accumulated option premiums. These premiums are reinvested into the long equity position. This has enabled the buy-write index to outperform the underlying equity index historically in a down, neutral or moderately up market (see Exhibits 2 and 3). In turn, the index has underperformed the underlying equity index during periods of strong rallies due to its capped upside potential (see Exhibit 4). Long-term live performance of the S&P/ASX BuyWrite Index is competitive with that of the S&P/ASX 200 (see Exhibit 5). The consistent reinvestment of option premiums has historically helped reduce the volatility of the covered call index compared to its underlying index (see Exhibit 5).


In the next blog, we will dig into the income-generating feature of this index. Stay tuned!

The posts on this blog are opinions, not advice. Please read our Disclaimers.

Commodities Flat in January After Second-Best Yearly Performance in Two Decades

Contributor Image
Jim Wiederhold

Former Director, Commodities and Real Assets

S&P Dow Jones Indices

The 24 individual commodities comprising the S&P GSCI finished the first month of 2023 with divergent performance. This echoed the uncertain path forward regarding inflation expectations. Half outperformed, with industrial metals leading the way, while the other half declined, with natural gas tanking, as European countries filled their tanks to their brims. Gold had one of its best starts to a year in a decade, while the agriculture and livestock sectors finished near flat for the month, which masked the volatility of the underlying commodities.

Market participants started 2023 by reversing some of the price action in key industrial metals. The S&P GSCI Zinc outperformed by 14.59%, as the London Metal Exchange (LME) metal inventory plunged to the lowest level since 1989. This was slightly offset by rising zinc inventories in China. The S&P GSCI Aluminum and S&P GSCI Copper rose by 11.34% and 10.45%, respectively, on the back of recent expectations of a soft landing globally. These three metals posted their best start to a year in over 30 years. The S&P GSCI Nickel cooled off after posting one if its best yearly performances in 2022. Industrial metals are considered the most crucial inputs to our future economy, with demand expected to pick up rapidly, while supply may be constrained over the next decade. China’s reopening from strict COVID-19 lockdown restrictions also contributed to the bullish price action in the sector.

The major news in the energy complex was the S&P GSCI Natural Gas dropping 34.22% in January due to a small glut of inventory, as Europe filled its tanks well above expectations. This coincided with a surprisingly warmer winter so far in the region, abating fears of undersupply after cutting off Russian imports. The petroleum complex finished flat, despite investors pilling back into petroleum futures and options at the fastest rate in more than two years.

The S&P GSCI Gold rose 6.02% in January, as the U.S. dollar continued its steady decline below 2022 highs. A demand for real assets and one of the strongest recent readings of global central bank purchases of the precious metal led market participants to position bullishly in gold. As a store of value in times of asset price decline, gold has historically performed well when other stores of value have deteriorated. In prior times of high and rising inflation, gold tended to lag other inflation-sensitive assets, and this time it seems to be no different.

The S&P GSCI Agriculture finished the month up 1.18%, with softs outperforming, while only wheat lagged. While wheat prices have dropped in the U.S., they rose to a multi-year high in India due to continued tight supply, as the harvest shrunk due to severe heat waves and higher export demand amid the Russia-Ukraine conflict.

Within the S&P GSCI Livestock sector, lean hogs underperformed dramatically, down . Similar to other commodity starts this year, this was a reversal from last year’s performance.

The posts on this blog are opinions, not advice. Please read our Disclaimers.

Examining the Dividend Risk Premium

How do you measure the dividend risk premium on the S&P 500 and why does it make sense to track with an index? S&P DJI’s Michael Mell takes a custom look at indexing dividend futures with Metaurus Advisors’ Rick Silva, and Compass Point Financial’s Andrew Jones.

The posts on this blog are opinions, not advice. Please read our Disclaimers.

Net-Zero Targets and Temperature Alignment: Two Sides of the Same Coin?

Contributor Image
Barbara Velado

Senior Analyst, Research & Design, Sustainability Indices

S&P Dow Jones Indices

For many people, a new year represents a chance to set new objectives and to tick (or scrap) the previous year’s list of resolutions. Whether this objective-setting exercise works is debatable. A similar phenomenon might be observed within companies. Scientific consensus maintains that net-zero emissions should be reached by 2050 if the world is to keep warming levels below 1.5°C, aligned with the goals of the Paris Agreement. As such, an increasing number of companies, countries and investment actors have been setting climate-related targets, which comprise one of the four pillars of the recommendations put forward by the Task Force on Climate-related Financial Disclosures (TCFD).1

Net-Zero Targets: From Commitment to Action

The Science-Based Targets Initiative (SBTI) is one of the leading organizations when it comes to supporting companies in setting and validating credible targets. To be validated by SBTI, targets must cover relevant emissions’ scopes, as well as being time-bounded and specific.2

From a regional standpoint, Europe is leading the way when it comes to corporate net-zero target setting, with more than 40% of companies by market cap having set a target within the S&P Europe 350®, while around a quarter of S&P 500® companies have done so (see Exhibit 1). All S&P ESG Index counterparts to the assessed universes have a higher percentage of companies with net-zero targets (see left-hand chart). From a sectoral lens, more than half of Consumer Staples’ companies have a verified target, with almost none in Energy being able to do so, due to fossil fuel involvement (see right-hand chart).3

But is corporate target setting indicative of alignment with the goals of the Paris Agreement? Intuitively, one could expect that companies that have set net-zero targets are more likely to be on a 1.5°C trajectory through relative or absolute decarbonization efforts. However, these might just be two sides of the same coin. While targets indicate commitment (or even ambition), S&P Global temperature alignment models compare historical and forward-looking projected emissions to a specified carbon budget.4 Thus, even companies with net-zero targets might be aligned with a >2°C pathway by the end of the century (see Exhibit 2).

Another way to explore the relationship between net-zero targets and temperature alignment is to look at the S&P Climate Strategy Score. This is sourced from the S&P Global Corporate Sustainability Assessment (CSA)5 under the environmental dimension and comprises questions related to climate targets, carbon pricing and TCFD disclosure, among others. A similar phenomenon occurs, where companies within low climate strategy quintiles can still be 1.5°C aligned, and vice-versa (see Exhibit 3).

How do different S&P 500-based indices fare when considering all these aspects? Most of S&P DJI’s sustainability indices show a Climate Strategy Score improvement relative to the underlying S&P 500, except the S&P Carbon Efficient Index (see Exhibit 4). There seems to be a positive relationship between the Climate Strategy Score and active net-zero target exposure, which might be expected, as one of the metrics assessed under the score is climate targets commitment. Yet, when it comes to temperature alignment, what was observed at the company level also seems to prove true at the index level: higher exposure to companies with net-zero targets and enhanced climate strategies does not necessarily translate into a 1.5°C outcome, according to S&P Global Trucost models.

Bridging the gap between climate ambition and action has been the focus of many organizations, investor-led groups and policymakers alike. While corporate target setting might be the first step in the right direction, continued decarbonization action needs to be sustained to stay within a 1.5°C budget. Net-zero indices that incorporate forward-looking metrics, such as the S&P PACT™ Indices (S&P Paris-Aligned & Climate Transition Indices) might help market participants align with a 1.5°C pathway, while increasing allocation to companies with climate-oriented targets and strategies.


1 Task Force on Climate-related Financial Disclosures (TCFD) recommends “Metrics & Targets” as one of the pillars for climate disclosures.

2 Companies are required to report annually on targets’ progress.

3 Companies involved in oil, natural gas and coal business activities are not currently able to set up SBTI targets.

4 Analysis performed using S&P Global Trucost’s Paris Alignment dataset.

5 For more information on the CSA, please see here.

The posts on this blog are opinions, not advice. Please read our Disclaimers.

What Performance Reversals Suggest

Contributor Image
Craig Lazzara

Former Managing Director, Index Investment Strategy

S&P Dow Jones Indices

Investment results in 2022 were distinctly different from those of the recent past. The S&P 500®, which had doubled in the three years between 2019 and 2021, fell by more than 18% last year, and Exhibit 1 shows that there were regime shifts among factor indices as well.

The dominance of Value over Growth in 2022 was especially remarkable. The one-year Value-Growth spread stands at the 97th percentile over all 12-month intervals since mid-1996. Equally interesting is that six years had passed since Value’s last “win” in 2016.

What can we infer from these factor shifts? Here are three important things:

First, they suggest considering passive management to be the default position for any asset owner—regardless of whether he’s seeking broad equity market exposure from the S&P 500, or more targeted factor exposure from one of the indices in Exhibit 1 (or their many cousins). Readers familiar with our SPIVA® Scorecards (and I hope that means all of you) will realize that most active managers underperform most of the time. That result holds true across capitalization and style segments: the same causes that make it hard for a core equity manager to beat the S&P 500 make it hard for a value manager to outperform the S&P 500 Value. An asset owner who opts for indicized factor exposure is likely to outperform an active manager operating in the same market segment.

Second, Exhibit 1 reminds us of the importance of patience. There are good theoretical arguments for why value should outperform growth, why low volatility should outperform high beta and why equal weight should outperform cap weight—but even if completely correct, those are arguments about long-run performance. Many low volatility or value investors spent the years between 2019 and 2021 wondering if something important had changed. 2022’s reversal was welcome, but it was a long time coming. In investment management, as in life generally, gratification must sometimes be deferred.

Finally, Exhibit 1 raises an important philosophical question: what is the point of factor indices in the first place? A value-driven factor index tracks relatively cheap stocks. A low volatility index tracks stocks with below-average volatility. A quality index tracks stocks with strong balance sheets and profitability. Are these characteristics, or others like them, desirable in themselves, or are they means to a different end? Low volatility indices, for example, are almost always less volatile than the benchmark from which their constituents are drawn, but as we saw above, they sometimes underperform. An asset owner who chooses Low Volatility because he wants less volatility is likely to be satisfied most of the time; his counterpart who chooses Low Volatility because he thinks it will outperform has much more potential for buyer’s remorse.

An investor who undertakes factor exposure as a means of outperforming should understand that no factor index outperforms all the time, and that his ability to tolerate periodic underperformance may have a major bearing on his success. The investor should strive to understand the conditions that will facilitate a factor’s success. At least as importantly, he should be clear about his own goals and motivations.

The posts on this blog are opinions, not advice. Please read our Disclaimers.