Get Indexology® Blog updates via email.

In This List

Despite a Bumpy Start to 2022, Latin America Outperforms Most Global Markets in Q3 and YTD

The S&P China 500 Dropped 20.3% in Q3 2022 as China Equities Caught Up with The Global Sell-Off

Leadership of Canadian Value Indices

Taking Higher Interest Rates in STRIDE

Spotlight on Commodities: Inflation and Innovation

Despite a Bumpy Start to 2022, Latin America Outperforms Most Global Markets in Q3 and YTD

Contributor Image
Silvia Kitchener

Director, Global Equity Indices, Latin America

S&P Dow Jones Indices

What a year it is turning out to be for Latin American equities. Despite the turbulence of the past three quarters, Latin America has been resilient. As shown in Exhibit 1, the S&P 500® and S&P Emerging BMI have declined in every quarter of 2022 and have lost more than 20% each YTD as of Sept. 30, 2022. Meanwhile, the S&P Latin America BMI gained 3.6% in Q3, edging into positive territory YTD.

While returns have been mixed across countries and quarters, it’s clear that Chile and Brazil’s stellar performance contributed to Latin America’s overall gains. Moreover, among global country indices Chile and Brazil ranked among the top five best performers for Q3 and YTD.1

The story in the region has not changed much since last quarter, with inflation, rising interest rates, the Russia-Ukraine conflict and domestic political uncertainty continuing to loom over the region. Despite these headwinds, markets in general have done relatively well in Q3. Except for Colombia and Mexico, all other equity markets gained during the quarter, with Argentina’s S&P MERVAL posting the largest gains of 57% in ARS. Chile’s S&P IPSA ended the quarter up 3% in CLP, and it was the only index with positive returns for every quarter of 2022. The S&P Brazil BMI’s strong returns of nearly 12% offset Mexico’s S&P/BMV IRT loss of 6%.

In terms of sectors, most ended on a positive note, with top performers Information Technology, Consumer Discretionary and Energy posting gains of 27.5%, 18.6% and 16.6%, respectively. The Financials sector, which gained 8.3%, and the Energy sector, up 16.6%, were the largest contributors to the overall returns for the region. Materials (-6.0%), the second-largest sector in the region after Financials, had the largest negative impact on the region’s returns for the quarter.

The top 10 largest companies by index weight, representing over 30% of the index, had a significant impact on performance in Q3. Specifically, Brazilian giants Petrobras and Itau Unibanco were major drivers in leading the region to positive territory. Mining companies like Brazil’s Vale, Mexico’s Grupo Mexico and Peru’s Southern Copper were significantly affected by the drop in metal prices for iron ore and copper, which were down 18.3% and 22.0% YTD, respectively.2 Communication Services ended the quarter at the far end of the negative side, driven by Mexico’s America Movil’s price drop of nearly 13% for Q3.

Despite the ups and downs of the markets, Latin American equities have remained resilient so far. As we enter Q4, it will be interesting to see if the region can hang on to these gains and hopefully add some more as the year comes to an end.

For more information on how Latin American benchmarks performed in Q3 2022, read the latest Latin America Scorecard.


1 S&P Global Equity Indices Monthly Update. Sept. 30, 2022. sp-global-equity-indices-monthly-update.pdf

2 Source: S&P Capital IQ Pro. Data as of Sept. 30, 2022. Iron Ore 62% FE (CME-NYMEX). Copper (COMEX).

The posts on this blog are opinions, not advice. Please read our Disclaimers.

The S&P China 500 Dropped 20.3% in Q3 2022 as China Equities Caught Up with The Global Sell-Off

Contributor Image
Sean Freer

Director, Global Equity Indices

S&P Dow Jones Indices

The S&P China 500 saw its largest quarterly drawdown in seven years, declining 20.3% in Q3 2022. While Chinese equities outperformed their global and emerging market counterparts in Q2, they significantly underperformed in Q3 and have now caught up with 2022’s global market downturn, with the S&P China 500 now in the red 29.4% YTD. The Information Technology and Health Care sectors led the sell-off, both giving up nearly a quarter of their value. The S&P China 500 significantly underperformed the broader S&P Emerging BMI and S&P Developed BMI, which declined 9.3% and 6.3%, respectively, during the quarter.

The S&P China 500 fared better than the majority of Asian markets, which also suffered significant drawdowns on the back of weakening local currencies and rising interest rates, leading to poor investor sentiment. The S&P Korea BM fared the worst, declining by 40.4%, followed by the S&P Taiwan BMI, down 33.3%, S&P Japan BMI, down 25.1%, and S&P Hong Kong BMI, down 21.1%. The S&P Indonesia BMI was the only benchmark in Asia to provide a positive return during the quarter, gaining 4.4%.

Despite the recent weakness in the market, the S&P China 500 continued to maintain positive performance over the long term. Having annualized gains of 5.5% in USD over the past 10 years, the index easily outperformed the S&P Emerging BMI, which gained only 2.4% over the same period.

Both Onshore and Offshore Stocks Declined

Both domestic and offshore-listed Chinese equities delivered double-digit negative returns during the quarter. The global downturn in equities this year resulted in a higher correlation in China’s equity share types, unlike in 2021, when onshore stocks outperformed offshore listings by more than 30%.


Information Technology and Health Care Led the Declines

Information Technology and Health Care stocks led the underperformance in Q3, both declining 24.3%. Companies within the Communication Services sector closely followed, down 23.8%, and given their approximate 15% weight in the index, they were the largest contributors to the negative return. The Energy sector was the only positive contributor during the quarter, gaining 2.5%.

At the company level, the major detractors to index return were the larger-weighted names, including Tencent (down 24.9%), Alibaba (down 29.7%) and Meituan Dianping (down 14.8%). On an absolute basis, CIFI Holdings (down 79.7%), Country Garden Services (down 66.9%) and Smoore International (down 61.2%) posted the worst performances among index constituents.

There were few noteworthy positive contributors to index return; China Shenhua Energy H-shares gained 4.2% and Shaanxi Coal posted a modest 1.5% gain, while Huadian Power was the largest absolute outperformer, gaining 42.9% during the quarter.

Valuation Metrics now More Attractive

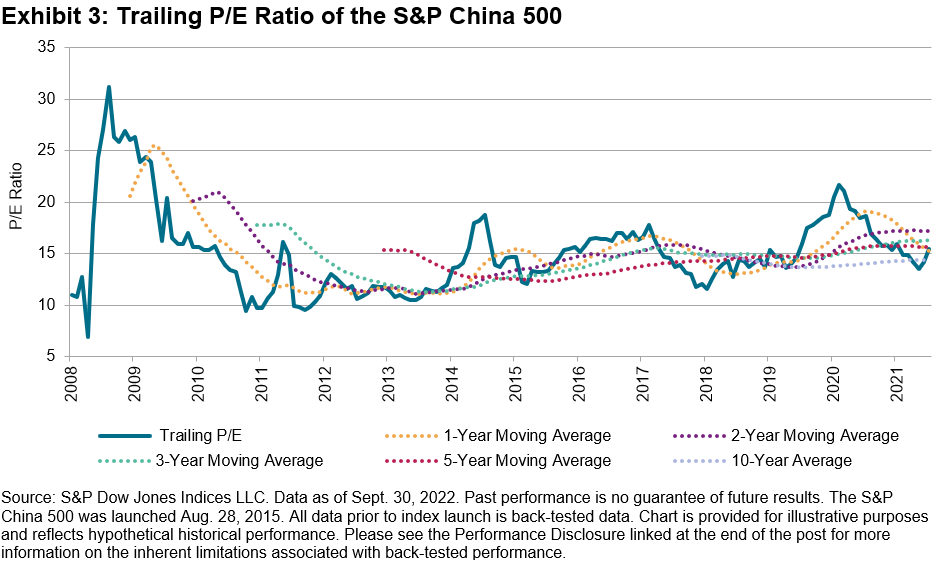
The S&P China 500 trailing P/E slipped to 13.6x in Q3 2022 (15.5x prior quarter), dropping below the 10-year average. Meanwhile, the rolling 1-, 3- and 5-year P/E ratios remained slightly above the longer-term average.

The S&P Emerging BMI trailing P/E also edged lower (12.7x), as share price declines were broad across ex-China emerging regions. The S&P China 500’s dividend yield, meanwhile, increased from 2.03% to 2.58% on a quarterly basis.

The posts on this blog are opinions, not advice. Please read our Disclaimers.

Leadership of Canadian Value Indices

Contributor Image
Hector Huitzil

Analyst, Global Equity Indices

S&P Dow Jones Indices

Introduction

How have value- and growth-oriented strategies performed in the Canadian equity market in recent years, especially given the recent resurgence in value-oriented companies?

Value investing is recognized as a well-known strategy that seeks to benefit from strength in fundamental characteristics of securities that might not be completely reflected in market prices, and it typically contrasts with growth strategies.

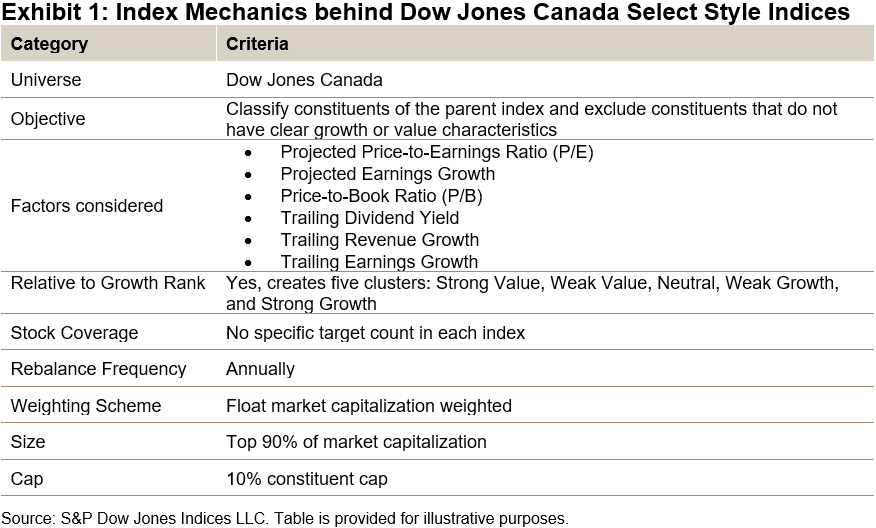
For this blog, we examine the value and growth implementation used by the Dow Jones Canada Select Style Indices, which use six metrics to determine style characteristics: two projected, two current, and two historical to classify each constituent, while small-caps are excluded altogether.

Constituent Characteristics and Recent Returns

Sector exposures for each style index contrast considerably from each other and the Canadian equity market as measured by the S&P/TSX 60. Exhibit 2 displays typical sector weights and a color scale that represents the intensity of exposure. While the S&P/TSX 60 has significant weights in the Financials and Energy sectors, the value index is exposed to these sectors primarily, and the growth index has heavier exposure to firms in the Industrials and Information Technology sectors. The growth index tends to capture a greater number of constituents and overall smaller total market capitalization than its value counterpart due to the fundamentals of the market segment. This leads to smaller size tilts in its exposure, although small-cap constituents are mainly excluded from the index universe.

These differences in sector exposure provide some insight into historical index performance. Returns of the Value index exceeded returns of its Growth counterpart and the S&P/TSX 60 over the past two years. During this time, the largest sectors within the Value index—Financials and Energy—were the best performing in the Canadian market, while the heaviest sector in the Growth index—Industrials—had only middling performance during the period and its second-largest sector was the main laggard in the Canadian market and contributed the most to the underperformance.

Exhibit 3 presents the cumulative returns for both indices and the broader Canadian market for the 20-year period, while Exhibit 4 presents the difference between rolling 12-month returns for the Value and Growth indices. A positive number in Exhibit 4 indicates outperformance in the 12-month returns by the Value index.

Over the 20-year period, the differences in performance translated into a cumulative return by the Value index that was 13% higher than the Growth index and 24% above the S&P/TSX 60. The most recent outperformance by the Value index started in 2021 and reached a magnitude not seen since 2009. This difference has translated into a higher cumulative gain than its counterpart and the Canadian benchmark.

Conclusion

Over the past two years, the Dow Jones Canada Select Value Index has outperformed its Growth counterpart and the broader Canadian equity market, while longer historical periods have also favored value. Market participants aiming to incorporate the value and growth factors may benefit from understanding the constituent selection process, index composition characteristics, and resulting historical returns of the Dow Jones Canada Select Style Indices.

The posts on this blog are opinions, not advice. Please read our Disclaimers.

Taking Higher Interest Rates in STRIDE

Contributor Image
Fei Mei Chan

Former Director, Core Product Management

S&P Dow Jones Indices

When it rains, it pours, and there’s no lack of bad news in 2022. The equity market is in solid bear territory, with the S&P 500® down 22% YTD. Inflation is high, and the Federal Reserve has aggressively hiked interest rates in recent months. The latest cycle of rate increases has happened faster than at any time since 1988. Rates have increased in both nominal and real (inflation-adjusted) terms. The current real yield curve sits significantly higher than at its most recent trough in July 2020.

Higher interest rates are often perceived to be bad for equity performance. Although it doesn’t always work out that way, this year, that prediction has come to fruition. Poor equity returns, other things being equal, are unpleasant for investors’ retirement portfolios. But generating returns is just one aspect of providing retirement security. An equally important aspect is to convert those cumulative returns into a sustainable, inflation-adjusted income stream. The S&P STRIDE Index Series is designed to facilitate both income generation and preserve purchasing power.

Targeting a dollar value of portfolio assets by retirement is aspirational. But budgeting for a stream of consumption costs post-retirement is actionable. The S&P STRIDE Series indicizes retirement income plan structures traditionally offered by annuities or defined benefit plans. Income costs are discounted back to today’s value using real interest rates. Higher rates imply lower costs of generating retirement income.

Our quarterly S&P STRIDE Dashboard provides regular updates on changes in the cost of retirement income. Exhibit 2 shows the cost for a dollar of retirement income for each of the 13 vintages that the S&P STRIDE Indices track.

Since real interest rates have risen dramatically in the past year, the cost of retirement income has declined significantly (lowest since 2015), particularly for longer-maturity vintages.

Additional resources:

Introducing the S&P STRIDE Index Series

Making STRIDEs in Evaluating the Performance of Retirement Solutions

The posts on this blog are opinions, not advice. Please read our Disclaimers.

Spotlight on Commodities: Inflation and Innovation

What could the convergence of inflation and interest rate tightening mean for commodities? CME Group’s Blu Putnam takes a fundamental look at global commodity markets with S&P DJI’s Jim Wiederhold and Kelsey Stokes.

The posts on this blog are opinions, not advice. Please read our Disclaimers.