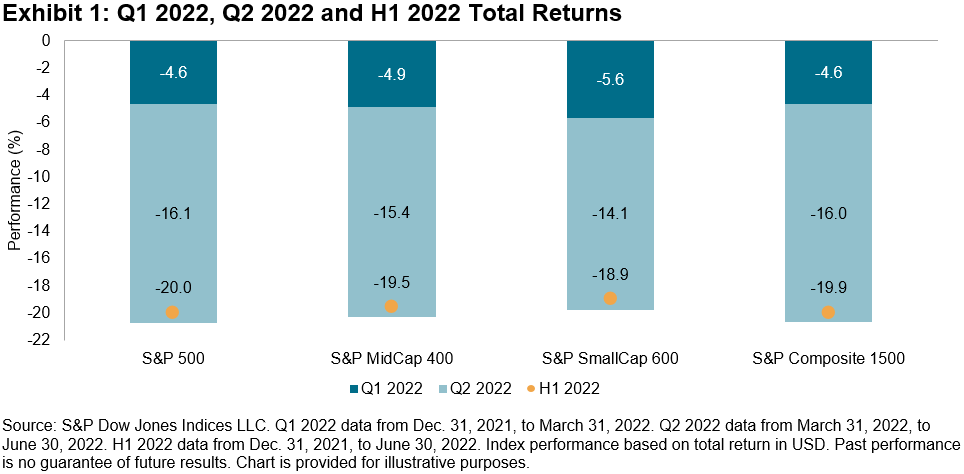
In Q2 2022, the S&P 500®, S&P MidCap 400® and S&P SmallCap 600® all fell about 15%, continuing the declines from Q1 as of June 30, 2022 (see Exhibit 1). The S&P 500 experienced its worst first half since 1970.
Amid the challenging environment, the S&P U.S. Core and Style Indices have generally proved more resilient than their respective Russell counterparts. As Exhibit 2 shows, the majority of S&P U.S. Core and Style Indices outperformed their Russell counterparts in H1 2022. For example, the S&P 900 posted the second largest margin against the Russell 1000 since 1996 (based on total returns in H1 each year), only trailing 1997. The S&P MidCap 400 Growth had the largest excess H1 returns since 2003, marking the 20th year in a row.
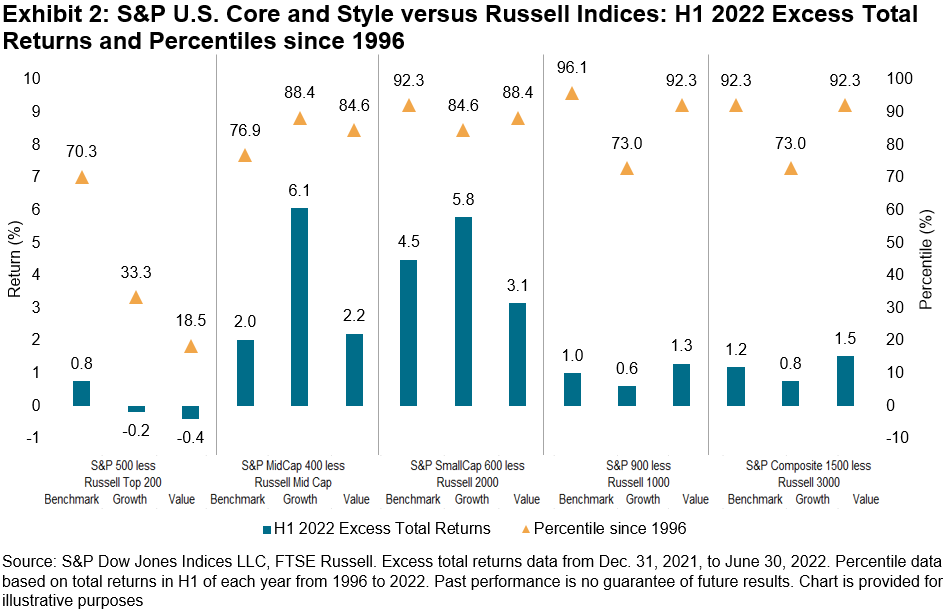
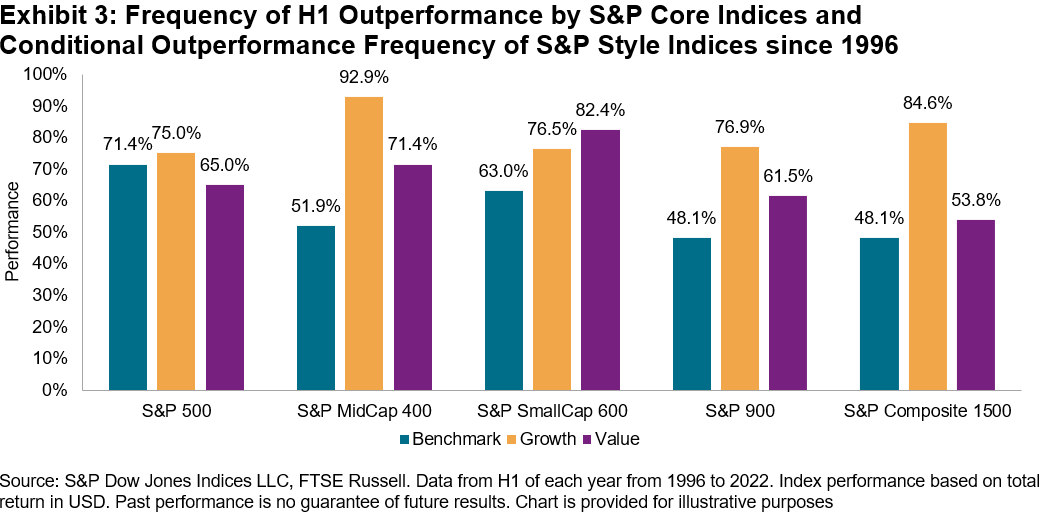
The outperformance of S&P U.S. Core and Style Indices in H1 2022 was not an uncommon phenomenon. S&P U.S. Core and Style Indices have typically outperformed in H1 of each year since 1996. Also, the outperformance from S&P DJI’s headline indices helped boost S&P Style Indices’ relative returns, highlighting the relevance of benchmark index construction. Exhibit 3 shows how the frequency of outperformance by the S&P Style Indices generally increased with the frequency of outperformance by S&P U.S. Core Equity Indices.
We have previously discussed how the S&P Composite 1500® is constructed differently than the Russell 3000. For example, new index additions to the S&P Composite 1500 need to have a history of positive earnings, whereas no such requirement is used by the Russell 3000. This affects index constituent selection and can help explain why the S&P U.S. Core Indices have had significant exposure to the quality factor. During the time periods when quality outperforms, this can lead to a positive selection effect relative to other indices.
One segment where the use of an earnings screen has made a big impact is in small caps. The S&P SmallCap 600 has outperformed the Russell 2000 by about 2% since 1994, based on differences in annualized total returns. Exhibit 4 shows that companies with a track record of positive earnings typically fared better this year: the selection effect accounted for over 80% of the S&P 600’s outperformance against the Russell 2000 in H1 2022. As for the allocation effect, the S&P 600’s underweight to the Health Care sector helped relative performance, whereas its underweight to Utilities detracted from relative returns.
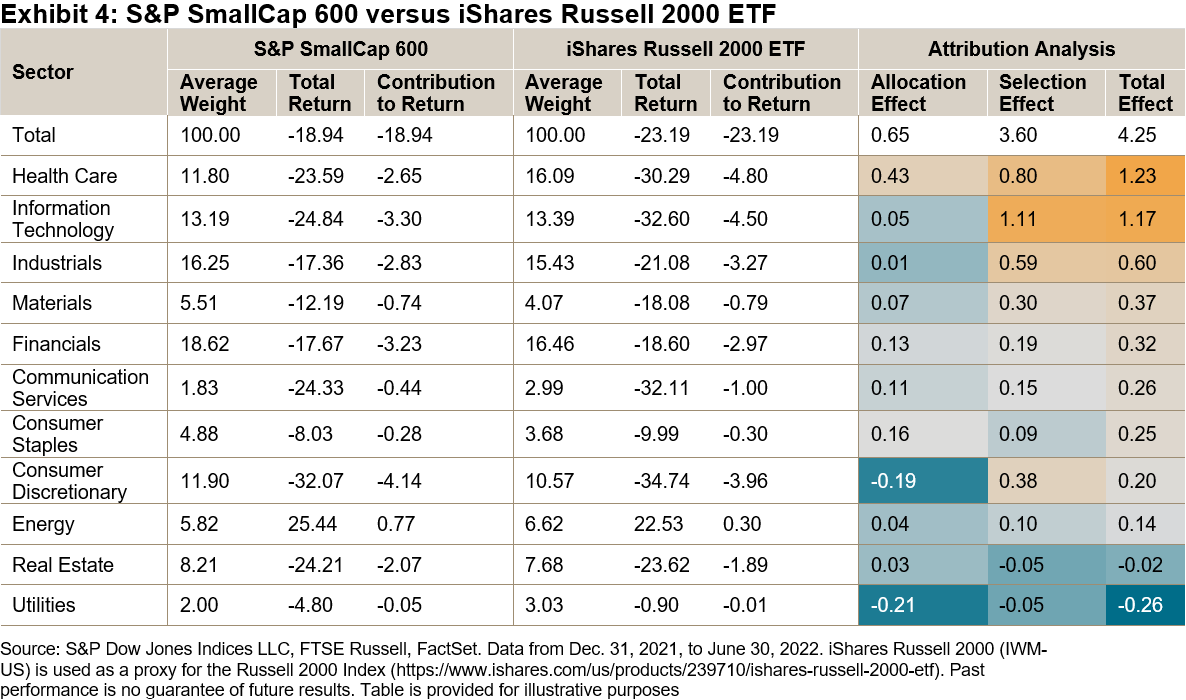
The first half of 2022 was extremely challenging for the U.S. equity market. However, there were some bright spots when comparing S&P DJI’s indices to its competitors. Across the style box, S&P DJI’s indices outperformed their Russell counterparts in nearly every category. In many cases, the relative performance was near the top of the historical range back to 1996. Digging into small caps, we see that the significant outperformance of the S&P SmallCap 600 was largely driven by the selection effect and the earnings screen. Over H1 2022 and the long term, a tilt toward profitable companies and the quality factor has benefitted the S&P SmallCap 600 relative to the Russell 2000.
The posts on this blog are opinions, not advice. Please read our Disclaimers.