Get Indexology® Blog updates via email.

In This List

Data Driving the Weights within the S&P 500 Net Zero 2050 Paris-Aligned ESG Index

Combining Dividend Strategies

A Closer Look at Indexing Equal Weight

Bearing Through

Luxury: A Durable and Diverse Theme

Data Driving the Weights within the S&P 500 Net Zero 2050 Paris-Aligned ESG Index

Contributor Image
Barbara Velado

Senior Analyst, Research & Design, Sustainability Indices

S&P Dow Jones Indices

The World Meteorological Organization estimates that there is a 50% chance that global warming will exceed 1.5°C before 2026.1 The International Panel on Climate Change has warned that time is running out—climate change is no longer a problem for the future, and its associated physical risks are materializing more evidently.2 The world may need to rapidly decarbonize to prevent irreversible impacts. The S&P PACT™ Indices (S&P Paris-Aligned and Climate Transition Indices) are designed to select equity securities that collectively aim to meet the goals of the Paris Agreement. Here we dive into the power of data in driving the weights within the S&P 500® Net Zero 2050 Paris-Aligned ESG Index and let the underlying data speak for itself.

S&P Paris-Aligned Index Weights Explained

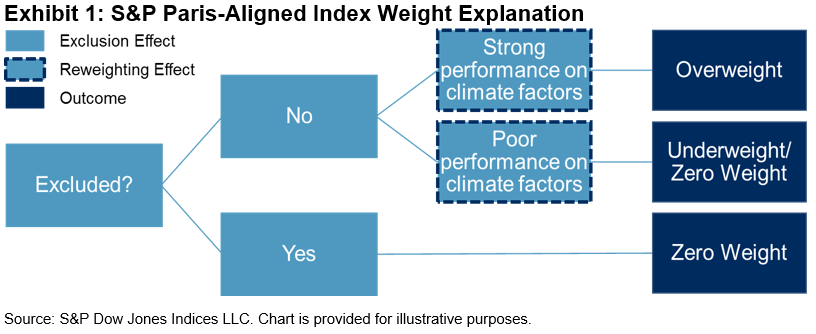
The S&P Paris-Aligned Indices start by excluding companies involved in undesirable business activities, and then the remaining constituents are reweighted based on their ESG and climate performance.3 This blog will focus on specific companies’ case studies to better illustrate this reweighting effect.

Climate and ESG Data Driving the Weights

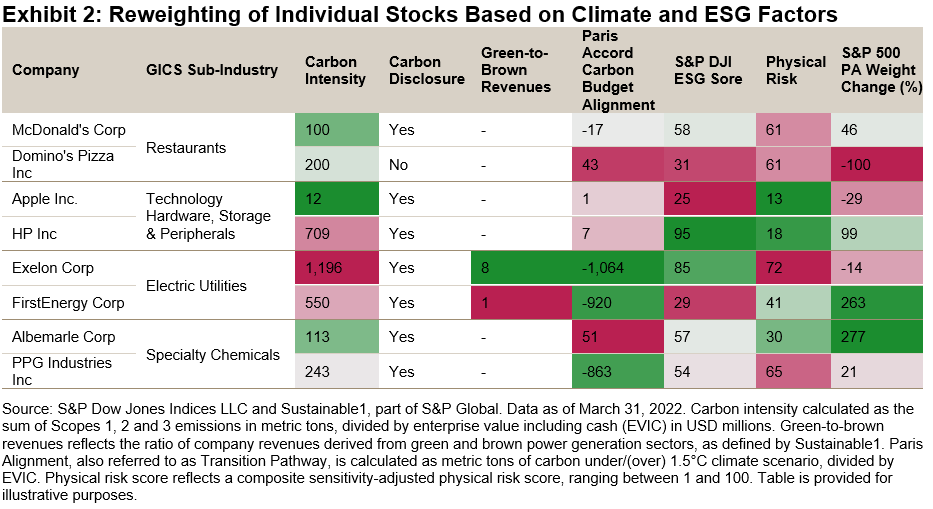
Exhibit 2 highlights how the underlying climate and ESG metrics drive the weights allocated to some of the stocks within the S&P 500 Net Zero 2050 Paris-Aligned ESG Index. To provide transparency on a relative basis, we look at four pairs of companies within the same sub-industry and their percentage weight change relative to its underlying index, the S&P 500. Green colors depict relatively positive performance on a climate or ESG factor, while pink shades reflect weaker values.

McDonald’s and Domino’s, two of the largest names within the American restaurant industry, received different weights. Despite both having high exposure to physical risks, McDonald’s alignment with a 1.5°C carbon budget and stronger S&P DJI ESG Score helped the company to be overweighted by 46% compared with its underlying index. Conversely, Domino’s was allocated 0% weight due to being above its transition pathway budget, which is the climate factor responsible for the largest reweighting effect.4 Since only 32%5 of stocks within the underlying index are below their respective 1.5°C carbon budgets, significant reweightings are applied at the stock level for the overall index to be 1.5°C compatible.

Apple and HP show similar alignment to a 1.5°C trajectory on a forward-looking basis and comparable physical risk scores. HP’s stronger sustainability performance, as measured by its S&P DJI ESG Score, led to its overweight (99%), while Apple lost some of its ground (-29%). As the S&P 500 Net Zero 2050 Paris-Aligned ESG Index targets a 20% increase of index-level ESG score relative to the underlying index, the ESG score plays a large role within the reweighting effect. Incorporating the ESG score into this climate strategy allows for a more holistic ESG performance assessment than looking at climate factors in isolation.

Within Electric Utilities, Exelon was underweighted (-14%) due to its high physical risk score, indicating high sensitivity and exposure to physical risks. Along with consideration for transition risks, the S&P 500 Net Zero 2050 Paris-Aligned ESG Index also aims to mitigate physical risks to fully address climate risks at the index level, aligning with the TCFD recommendations.6 FirstEnergy, despite having lower green-to-brown revenue share, received a large overweight (263%) thanks to being below its 1.5°C carbon budget and lower physical risk score.

Lastly, within Specialty Chemicals, both Albemarle and PPG Industries were overweighted, albeit to different degrees. Despite being below its 1.5°C carbon budget and displaying a similar S&P DJI ESG Score to Albemarle, PPG Industries’ high physical risk score curbed its overweight to 21%, while its peer’s weight was boosted by 277%.

We aim to provide transparency on how the S&P PACT Indices constituents’ weights are determined by their climate and ESG performance. Coupled with the 7% year-on-year self-decarbonization pathway, the S&P PACT Indices seek to offer an efficient and multifaceted solution for investment product providers to align investments with a net-zero journey.


1 According to the World Meteorological Organization (WMO) Climate Update.

2 According to the contribution of IPCC’s Working Group II to the Sixth Assessment Report on Climate Change 2022: Impacts, Adaptation and Vulnerability.

3 Please see the S&P Paris-Aligned and Climate Transition Indices Methodology for more information.

4 Leale-Green, B., Velado, B. (2020). Exploring S&P PACT Indices Weight Attribution.

5 As of March 31, 2022, 32% of constituents by index weight within the S&P 500 were under their carbon budget for 1.5°C climate scenario alignment.

6 Final Report: Recommendations of the Task Force on Climate-Related Financial Disclosures (2017), available here.

The posts on this blog are opinions, not advice. Please read our Disclaimers.

Combining Dividend Strategies

Contributor Image
Craig Lazzara

Former Managing Director, Index Investment Strategy

S&P Dow Jones Indices

Throughout this year’s market turmoil, dividend strategies have been among the most reliable sources of relative, if not absolute, performance. Through June 21, 2022, e.g., when the S&P 500® had declined -20.4% YTD, the S&P 500 High Dividend Index (roughly speaking, the 80 highest-yielding stocks in the 500) sustained a loss of only -3.7%. The S&P 500 Dividend Aristocrats®, which focuses on dividend growth rather than absolute dividend levels, declined -14.0%—well behind its higher-yielding compatriot but still significantly ahead of the market as a whole.

We’ve commented before on the relative merits of dividend yield and dividend growth strategies, suggesting that their comparative performance is analogous to the shifting performance of value and growth. For nearly 15 years, as S&P 500 Growth dominated S&P 500 Value, the Dividend Aristocrats handily outperformed High Dividend. At the beginning of 2022, however, the tables turned: Value is trouncing Growth, and dividend yield is well ahead of dividend growth.

Lacking the ability to forecast the future relative performance of High Dividend and Dividend Aristocrats (or at least the ability to forecast it accurately), it’s natural to wonder about the results of combining the two strategies. Although the short-term advantage can shift between the two indices, in the long run the performance of High Dividend and Dividend Aristocrats has been comparable, and the correlation between their relative returns has typically been in the 0.6 to 0.7 range. This suggests that the indices’ co-movement, although reasonably strong, is not perfect, so that combining them might produce at least some diversification benefit. Exhibit 1 illustrates this with three sets of index combinations.

The gold curve illustrates combinations of the S&P 500 and the S&P 500 High Dividend Index. High Dividend has had both higher historical returns and higher risk than the 500, so the efficient frontier between them, after some initial curvature, moves upward and to the right, as all good efficient frontiers are wont to do.

The blue curve is more interesting; it shows combinations of the S&P 500 and the S&P 500 Dividend Aristocrats. Notice that this efficient frontier moves upward and to the left; Dividend Aristocrats historically has had higher returns and been less volatile than the S&P 500. It is, in other words, a member in good standing of the class of indices that benefit from the low volatility anomaly—the tendency of stocks with below-average volatility to outperform the market as a whole.

Most interesting of all is the green curve, which illustrates combinations of the Dividend Aristocrats and High Dividend indices. It’s interesting because it dominates both the efficient frontiers beneath it. Combinations of Dividend Aristocrats and High Dividend have provided more return for the same level of risk as combinations of either index singly with the S&P 500.

This finding implies that dividend-seeking investors need not feel pressured to choose between dividend levels and dividend growth. Combining the two strategies can potentially produce a more attractive risk/return profile than holding either in isolation.

The posts on this blog are opinions, not advice. Please read our Disclaimers.

A Closer Look at Indexing Equal Weight

How does indexing equal weight work in times of volatility and inflation? S&P DJI’s Craig Lazzara and Invesco’s Nick Kalivas discuss the key drivers behind equal-weight’s historical outperformance vs. the benchmark and what happens when equal weight is combined with factors and/or ESG.

The posts on this blog are opinions, not advice. Please read our Disclaimers.

Bearing Through

Contributor Image
Fei Mei Chan

Former Director, Core Product Management

S&P Dow Jones Indices

On Monday, June 13, 2022, the S&P 500® officially entered bear market territory, having lost more than 20% of the value from its peak on Jan. 3, 2022. Just as we didn’t know on Jan. 3 that the market was going to decline, today we don’t know the full extent and duration of the new bear market.

An obvious way to consider this question is to compare the current decline with its historical predecessors. Exhibit 1 shows that we are now experiencing the fourth bear market in the last 30 years. Its 23% decline so far is smaller than the other three, and substantially smaller than the declines in the aftermath of the Technology Bubble (2000-2002) and the Global Financial Crisis (2008). Of course, it’s fair to observe that the current decline is not over.

We’ve found that dispersion and correlation can provide useful context around market dynamics. Exhibit 2’s dispersion-correlation map shows that historically, poor markets have only occurred in the presence of high dispersion. (Importantly, the converse is not true: high dispersion is not a reliable indicator of poor markets.) This was particularly evident in both the Technology Bust (2000-2002) and the 2008 Global Financial Crisis. Average monthly dispersion levels in those years all exceeded 30%. In contrast, dispersion so far in 2022, while higher than its long-term median, has remained lower than in the previous two bear markets. Whether this remains the case when the current bear market finally ends is another subject of uncertainty.

As of June 17, 2022, we are 165 days into the current bear cycle. As Exhibit 3 shows, both the Tech Bust and the Global Financial Crisis lasted much longer (929 days and 517 days, respectively). As when we entered the bear market in January, we won’t know that it’s over until after the fact.

The posts on this blog are opinions, not advice. Please read our Disclaimers.

Luxury: A Durable and Diverse Theme

Contributor Image
Srineel Jalagani

Senior Director, Thematic Indices

S&P Dow Jones Indices

Luxury Lies in the Eyes of the Consumer

The term luxury summons a variety of ideas to mind. The range spans from caviar to corvettes, and gin to jewelry. While luxury products are varied, the brands behind them are well-known and etched into our cultural memory. Brands like Gucci, Luis Vuitton and Porsche are nearly a century old. The luxury segment’s durability is echoed in its revenues that grew by 6% CAGR according to some estimates1 during the 1996-2018 period, highlighting the positive impact of globalization on luxury markets from the opening of the Asian economies.

Outperformance Retracement Rather Than Underperformance

Our S&P Global Luxury Index is designed to measure stocks that are engaged in the production, distribution or provision of luxury goods and services, from specific GICS® industries that align with the luxury theme.2 Our index construction methodology assigns a score to indicate the relevance of a company to the current luxury theme, and this process incorporates the evolving nature of consumer preferences. The current index is composed mainly of companies from Developed Markets (see Exhibit 1), and it has a mid-cap size tilt and is skewed toward Consumer Discretionary firms.

Luxury segment revenues are significantly dependent on the discretionary component of consumer spending, which in turn is influenced by macro risk, inflation and labor markets, the first two of which have not been supportive of the recent market performance. Unsurprisingly, the index was down ~35% from its November 2021 peak and was underperforming the S&P Global BMI by ~12% (almost entirely due to the allocation effect of being overweight the Consumer Discretionary sector). However, this recent underperformance comes after the index nearly tripled during the March 2020-October 2021 period, outperforming S&P Global BMI by ~100%. This strength during a period of rolling global shutdowns emphasizes the resilience of the global luxury market.

Diversification Underpins Versatility

The following characteristics advocate for why the luxury segment could be an attractive theme, notwithstanding near-term pressure from continued weakening consumer sentiment.

  • Breadth within the luxury ecosystem: As we referenced earlier, luxury’s subjective nature necessitates its breadth across various economic industries when constructing a robust index. The S&P Global Luxury Index’s composition is diversified, with Apparel, Accessories & Luxury Goods (36%) and Automobile Manufactures (24%) forming the largest sub-industries, followed by Distillers & Vintners (10%) and Hotels, Resorts & Cruise Lines (9%). The range of industries included within the index also provides a broader consumer base that acts as a buffer during weaker phases of the economic cycles.

  • Diverse revenue streams: Revenue from U.S. and Chinese markets account for roughly 45% of the index revenue,3 areas that are relatively less affected by the Russia-Ukraine conflict. Non-European countries within the top 10 revenue generators account for an additional 15%, underscoring the curtailed impact of the ongoing geopolitical fallout. The index revenue aggregated at the RBICS4 sub-sector level also shows that Automobile Manufacturers was the largest portion (~40%), followed by the more “traditional” luxury segment of Apparel, Accessories & Luxury Goods (~25%).

  • Resilience through the pandemic: The worldwide shutdown saw revenues of the luxury industry fall by ~20%.5 Nonetheless, the industry was adept in using the shutdowns as a transformative opportunity—like pivoting further toward online sales channels, increasing focus on the Gen Z and Gen X consumer segments, and targeting near-home purchases, especially in China. In terms of index fundamentals, while valuations (P/CF, P/S) looked relatively expensive in February-March 2021 during the height of Growth outperformance, recent market weakness has pared the ratios. In fact, the P/CF has normalized more than P/S YTD, hinting at improving cashflows at a faster clip than sales, underscoring the industry’s adaptability.

  • Embracing the future: Luxury companies have continued innovating across various fronts to appeal to brand-conscious consumers with changing habits.6 While sustainability, ethical fashion and biomaterials are becoming focus areas within real-world fashion, NFTs and avatar skins are the new frontiers being tested by luxury companies in the digital world. The automobile segment of the luxury market has increasingly adopted the switch to electric motors and battery technology, ensuring their relevance and market share as the world marches toward a greener economy.

In conclusion, S&P Global Luxury Index’s approach to incorporate breadth and diversification when targeting the luxury market, enhances the appeal of a durable industry that demonstrated adaptability and nimbleness during the COVID-19 pandemic. Investors could benefit from exposure to the luxury theme, as the affluence of global consumers rises, and brands align more closely with their patrons’ ethics across the digital and real worlds.

1https://www.bain.com/contentassets/8df501b9f8d6442eba00040246c6b4f9/bain_digest__luxury_goods_worldwide_market_study_fall_winter_2018.pdf

2https://www.spglobal.com/spdji/kr/documents/methodologies/methodology-sp-global-luxury-index.pdf

3 FactSet GeoRev data. Data aggregated from 2020 and 2021 reports.

4 FactSet RBICS is a comprehensive, structured taxonomy designed to offer a precise classification of global companies and their individual business segments. More details can be found at https://insight.factset.com/resources/factset-revere-business-industry-classifications-datafeed

5 https://www.bain.com/insights/the-future-of-luxury-bouncing-back-from-covid-19/

6 https://www2.deloitte.com/global/en/pages/consumer-business/articles/gx-cb-global-powers-of-luxury-goods.html

The posts on this blog are opinions, not advice. Please read our Disclaimers.