Get Indexology® Blog updates via email.

In This List

Luxury: A Durable and Diverse Theme

Canadian Equities Go the Way of Global Equities

Why What’s Inside the Style Box Matters

Rebalancing Report: The S&P/ASX 200 ESG Index

Opportunity to Outperform

Luxury: A Durable and Diverse Theme

Contributor Image
Srineel Jalagani

Senior Director, Thematic Indices

S&P Dow Jones Indices

Luxury Lies in the Eyes of the Consumer

The term luxury summons a variety of ideas to mind. The range spans from caviar to corvettes, and gin to jewelry. While luxury products are varied, the brands behind them are well-known and etched into our cultural memory. Brands like Gucci, Luis Vuitton and Porsche are nearly a century old. The luxury segment’s durability is echoed in its revenues that grew by 6% CAGR according to some estimates1 during the 1996-2018 period, highlighting the positive impact of globalization on luxury markets from the opening of the Asian economies.

Outperformance Retracement Rather Than Underperformance

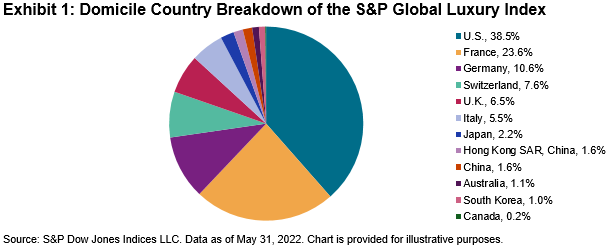
Our S&P Global Luxury Index is designed to measure stocks that are engaged in the production, distribution or provision of luxury goods and services, from specific GICS® industries that align with the luxury theme.2 Our index construction methodology assigns a score to indicate the relevance of a company to the current luxury theme, and this process incorporates the evolving nature of consumer preferences. The current index is composed mainly of companies from Developed Markets (see Exhibit 1), and it has a mid-cap size tilt and is skewed toward Consumer Discretionary firms.

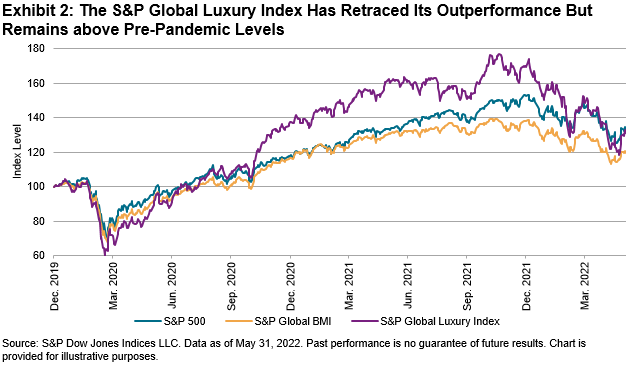
Luxury segment revenues are significantly dependent on the discretionary component of consumer spending, which in turn is influenced by macro risk, inflation and labor markets, the first two of which have not been supportive of the recent market performance. Unsurprisingly, the index was down ~35% from its November 2021 peak and was underperforming the S&P Global BMI by ~12% (almost entirely due to the allocation effect of being overweight the Consumer Discretionary sector). However, this recent underperformance comes after the index nearly tripled during the March 2020-October 2021 period, outperforming S&P Global BMI by ~100%. This strength during a period of rolling global shutdowns emphasizes the resilience of the global luxury market.

Diversification Underpins Versatility

The following characteristics advocate for why the luxury segment could be an attractive theme, notwithstanding near-term pressure from continued weakening consumer sentiment.

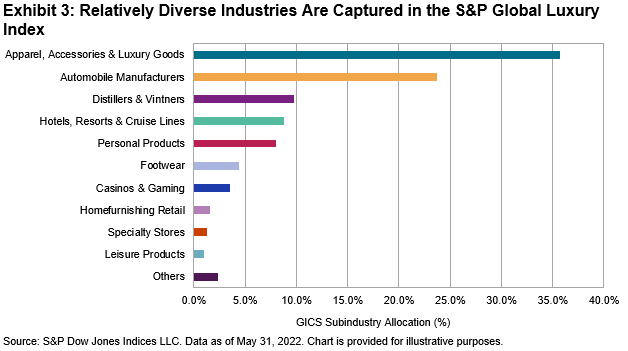
  • Breadth within the luxury ecosystem: As we referenced earlier, luxury’s subjective nature necessitates its breadth across various economic industries when constructing a robust index. The S&P Global Luxury Index’s composition is diversified, with Apparel, Accessories & Luxury Goods (36%) and Automobile Manufactures (24%) forming the largest sub-industries, followed by Distillers & Vintners (10%) and Hotels, Resorts & Cruise Lines (9%). The range of industries included within the index also provides a broader consumer base that acts as a buffer during weaker phases of the economic cycles.

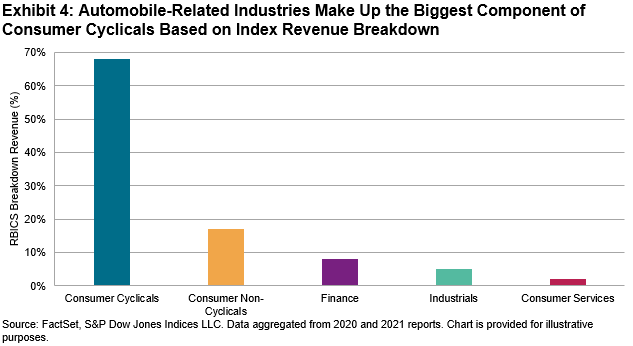
  • Diverse revenue streams: Revenue from U.S. and Chinese markets account for roughly 45% of the index revenue,3 areas that are relatively less affected by the Russia-Ukraine conflict. Non-European countries within the top 10 revenue generators account for an additional 15%, underscoring the curtailed impact of the ongoing geopolitical fallout. The index revenue aggregated at the RBICS4 sub-sector level also shows that Automobile Manufacturers was the largest portion (~40%), followed by the more “traditional” luxury segment of Apparel, Accessories & Luxury Goods (~25%).

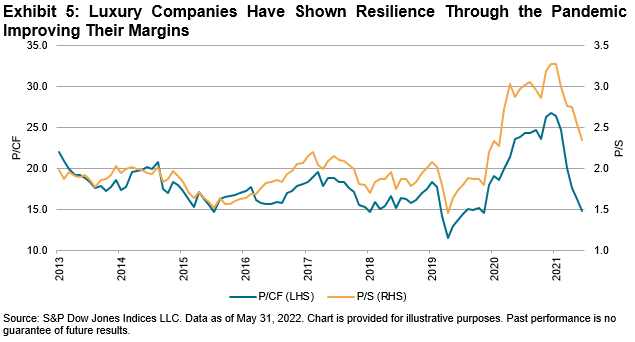
  • Resilience through the pandemic: The worldwide shutdown saw revenues of the luxury industry fall by ~20%.5 Nonetheless, the industry was adept in using the shutdowns as a transformative opportunity—like pivoting further toward online sales channels, increasing focus on the Gen Z and Gen X consumer segments, and targeting near-home purchases, especially in China. In terms of index fundamentals, while valuations (P/CF, P/S) looked relatively expensive in February-March 2021 during the height of Growth outperformance, recent market weakness has pared the ratios. In fact, the P/CF has normalized more than P/S YTD, hinting at improving cashflows at a faster clip than sales, underscoring the industry’s adaptability.

  • Embracing the future: Luxury companies have continued innovating across various fronts to appeal to brand-conscious consumers with changing habits.6 While sustainability, ethical fashion and biomaterials are becoming focus areas within real-world fashion, NFTs and avatar skins are the new frontiers being tested by luxury companies in the digital world. The automobile segment of the luxury market has increasingly adopted the switch to electric motors and battery technology, ensuring their relevance and market share as the world marches toward a greener economy.

In conclusion, S&P Global Luxury Index’s approach to incorporate breadth and diversification when targeting the luxury market, enhances the appeal of a durable industry that demonstrated adaptability and nimbleness during the COVID-19 pandemic. Investors could benefit from exposure to the luxury theme, as the affluence of global consumers rises, and brands align more closely with their patrons’ ethics across the digital and real worlds.

1https://www.bain.com/contentassets/8df501b9f8d6442eba00040246c6b4f9/bain_digest__luxury_goods_worldwide_market_study_fall_winter_2018.pdf

2https://www.spglobal.com/spdji/kr/documents/methodologies/methodology-sp-global-luxury-index.pdf

3 FactSet GeoRev data. Data aggregated from 2020 and 2021 reports.

4 FactSet RBICS is a comprehensive, structured taxonomy designed to offer a precise classification of global companies and their individual business segments. More details can be found at https://insight.factset.com/resources/factset-revere-business-industry-classifications-datafeed

5 https://www.bain.com/insights/the-future-of-luxury-bouncing-back-from-covid-19/

6 https://www2.deloitte.com/global/en/pages/consumer-business/articles/gx-cb-global-powers-of-luxury-goods.html

The posts on this blog are opinions, not advice. Please read our Disclaimers.

Canadian Equities Go the Way of Global Equities

Contributor Image
Fei Mei Chan

Former Director, Core Product Management

S&P Dow Jones Indices

There has been no shortage of macroeconomic headwinds in 2022. Canadian equities were an exception in posting gains for the first three months of the year, but they have since fallen in step with most global equity markets. The S&P/TSX Composite Index lost 12.07% since its last rebalance on March 17, 2022. Uncommonly, the S&P/TSX Composite Low Volatility Index underperformed slightly, losing 12.34% in the same period.

With the market’s decline, volatility has, unsurprisingly, increased for all sectors of the S&P/TSX Composite Index, with the Information Technology notching the biggest jump (see Exhibit 1).

The impact of these changes on the S&P/TSX Composite Low Volatility Index was limited, since the index had already eliminated all holdings in the Consumer Discretionary, Information Technology and Materials sectors. As of the latest rebalance, effective at the close of trading on June 17, 2022, Low Volatility continues to hold just eight sectors, with the largest concentrations in Financials, Real Estate and Utilities (despite Real Estate having been pared back 6%). Communication Services, Energy and Utilities all added to their weights.


The posts on this blog are opinions, not advice. Please read our Disclaimers.

Why What’s Inside the Style Box Matters

Take a closer look at the style spectrum with S&P DJI’s Garrett Glawe and explore how index construction influences risk/return.

The posts on this blog are opinions, not advice. Please read our Disclaimers.

Rebalancing Report: The S&P/ASX 200 ESG Index

Contributor Image
Daniel Perrone

Former Director and Head of Operations, ESG Indices

S&P Dow Jones Indices

The S&P/ASX 200 ESG Index recently underwent its annual rebalancing, and it was the first rebalance following the recent changes to the S&P ESG Index Series Methodology. As a result, 14 companies were added to the index and 23 companies were removed, with some high-profile names on the move. In this blog, we’ll discuss the methodology changes recently implemented and their impact on the index, and we’ll highlight a few key movers in and out of the index.

Effective with this rebalancing, companies with involvement1 in oil sands, small arms and military contracting became ineligible for the S&P ESG Index Series. At this point in time, there are no companies in the S&P/ASX 200 that have meaningful involvement in these areas, though the possibility exists for future entrants into the index to find themselves ineligible for the ESG version. In addition, the data source for compliance with the United Nations Global Compact (UNGC) has been updated from a continuous (scores ranging from 0 to 100) to a discrete (compliant/non-compliant) data set for greater transparency and easier interpretation. This modification also resulted in no immediate changes to the index.

Lastly, existing constituents of the S&P/ASX 200 ESG Index will begin to be reviewed on a quarterly basis to ensure they continue to meet the eligibility criteria for the index. This will ensure that changes to a company’s business profile that violate the index methodology are actioned upon in a timely manner.

The most noteworthy change to the index composition is the addition of Commonwealth Bank Australia (CBA) and subsequent removal of Westpac Banking Corp. (WBC). CBA’s controversies surrounding breaches of anti-money-laundering laws and complaints of fraud, poor financial advice and charges for services not provided to customers (all of which were captured by S&P Global’s Media & Stakeholder Analysis) have been well documented, though over the past two years, their S&P DJI ESG Score has recovered, as the company has made jumps in the areas of sustainable finance, climate strategy and human rights.

As such, CBA leapfrogged WBC in their industry group, moving up from being ranked fourth to third (by S&P DJI ESG Score) and resulting in its first-time addition into the index.

Additionally, another first-time eligible company was added to the index: Paladin Energy Ltd., part of the GICS® Energy industry group. Paladin Energy was added to the underlying S&P/ASX 200 last December. In many cases, new additions to an index result in a corresponding drop from the same industry group. In this case, Worley Ltd., whose S&P DJI ESG Score dropped 12 points from 42 to 30, was removed from the index.

Overall, the 14 additions to the index represented just over AUD 268 billion in float-adjusted market capitalization (as of April 29, 2022, the index rebalancing date), with the 23 drops totaling over AUD 174 billion. The changes implemented as part of this rebalancing ensure that the index continues to provide broad-market exposure to the Australian market alongside an improved sustainability profile.


1 Exact revenue thresholds for eligibility can be found in the S&P ESG Index Series Methodology.

The posts on this blog are opinions, not advice. Please read our Disclaimers.

Opportunity to Outperform

Contributor Image
Anu Ganti

U.S. Head of Index Investment Strategy

S&P Dow Jones Indices

It’s been a challenging year for U.S. equities as investors adjust to a new rising rate regime, with inflation concerns at the forefront, coupled with uncertainty around future economic growth. Market commentators have argued that this environment is ideal for stock pickers to shine.

This argument is correct, but with a caveat. With the S&P 500® down 13% year-to-date through May 31, we are in precisely the environment in which skillful active portfolio managers have the most potential to add value, since relative returns are easier to achieve when absolute returns are poor. Poor returns are usually accompanied by increased market volatility, and high volatility can help active managers in two distinct ways.

Higher volatility can manifest itself as both higher dispersion and higher correlation. Higher dispersion means a wider gap between winners and losers, while higher correlation indicates a tendency for stocks to move together. The value of stock-selection skill rises when dispersion is high: a more significant gap between winners and losers means that active managers have a better chance of displaying their stock-selection abilities. Exhibit 1 shows that dispersion levels in the S&P 500 have increased since Q3 2021 and are currently above their historical average.

While more subtle than the obvious advantage of high dispersion, active managers should also prefer high correlations over low correlations. Because active portfolios are typically more concentrated and more volatile than their index benchmarks, active managers forgo a diversification benefit. When correlations are high, the benefit of diversification falls, as does the benefit forgone, making active management easier to justify.

Exhibit 2 shows that as macro risks have risen, so too have correlations; in fact, the reading of 0.48 as of May 2022 is the highest since September 2020.

Both high dispersion and high correlations are now working in active managers’ favor. Higher dispersion means that the value of selection skill rises, while higher correlation implies a lower volatility hurdle to overcome. However, high potential for outperformance does not automatically translate into actual outperformance. There is an equally high potential for embarrassment for stock pickers without the requisite skill. When SPIVA® results for year-end 2022 become available next year, we will learn how many active managers were able to capitalize on this opportunity.

The posts on this blog are opinions, not advice. Please read our Disclaimers.