Get Indexology® Blog updates via email.

In This List

Seven Days in May

Defending with S&P Dividend Aristocrats

These Go to 11: Diversification with S&P 500 Sectors

The S&P MidCap 400: An Overlooked Gem

Index-Based Tools for Tracking the Future

Seven Days in May

Contributor Image
Craig Lazzara

Former Managing Director, Index Investment Strategy

S&P Dow Jones Indices

The performance of S&P 500®-based factor indices in May 2022 was generally favorable. Most factors outperformed the S&P 500, with the league table dominated by value and dividend tilts. The overall results for the month, however, obscure the intra-month dynamics: between the end of April and May 19, the S&P 500 fell by 5.5%, compounding the loss of 12.9% it had incurred in the first four months of the year. Despite briefly trading in bear market territory, in the last seven trading days of May, the index rallied 6.0% to finish the month with a small gain.

It should surprise no one that the relative performance of factor indices varied widely between these two distinct periods. What’s remarkable is that investors’ changing preference for dividend yield explains a great deal of that variation.

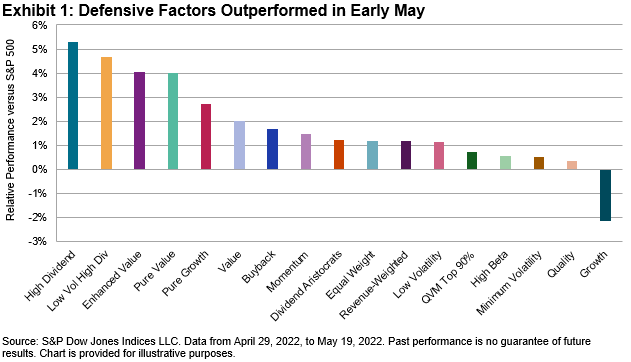
Exhibit 1 shows the relative performance of several significant factor indices for the first 19 days of May. With the S&P 500 down, the best relative performers were defensively oriented. High Dividend and Low Volatility High Dividend took the lead, with the year’s consistent laggard Growth at the opposite end of the distribution.

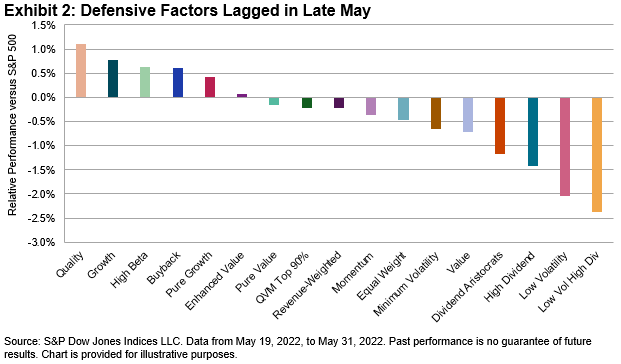
When the market began to rally, however, investors’ factor preferences shifted. Exhibit 2 shows us the same factors’ relative performance during the late-May rally. Growth and Quality, the worst performers early in the month, assumed the top positions, as defensive factors underperformed. The two periods are not exact mirror images, but there’s a clear tendency for the outperformers of Exhibit 1 to underperform in Exhibit 2. (The correlation of relative returns across the two periods is -0.47.)

Understanding the impact of fundamental explanatory variables on factor index returns can help us understand May’s reversal in factor behavior. For example, a factor index’s growth or value score, and some sectoral over- and underweights, can shed light on performance. The most consistently useful indicator, in both the market decline in early May and the rally at the end, was dividend yield.

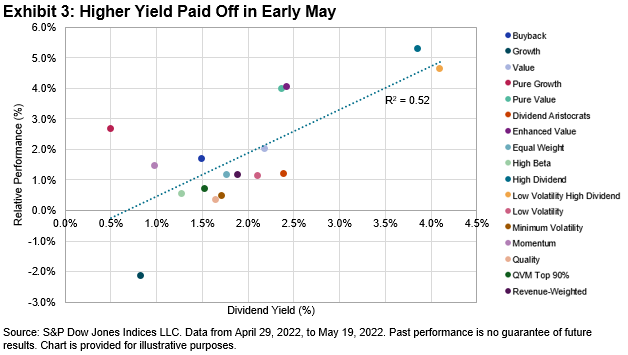
Exhibit 3 shows the relationship between each factor index’s beginning yield with its performance during the first 19 days of May. The relationship is strong, and upward-sloping; higher yield produced better relative performance.

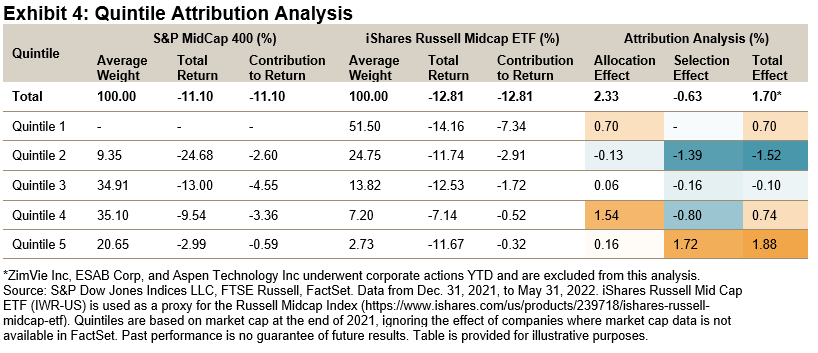
The worm turned, however, after May 19, as Exhibit 4 illustrates. As the market rallied during the last seven trading days of the month, the highest-yielding factors underperformed, while their lower-yielding counterparts assumed a leadership position.

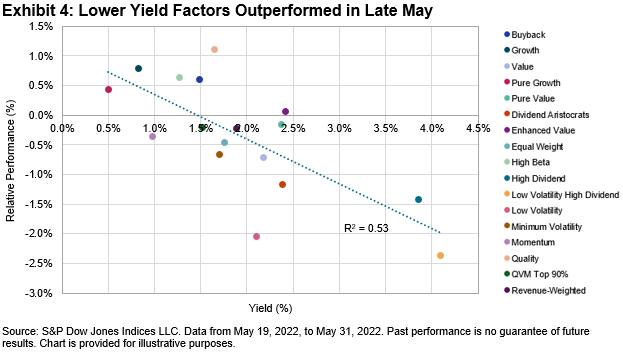
It’s no surprise that dividend yield tends to pay off in the long run, but its short-run explanatory power in May was also impressive. It’s perhaps too facile to observe that yield was a good proxy for the shift of market emphasis from risk-off early in the month to risk-on at the end. How long yield’s predictive power will last, and in which direction, remains to be seen.

The posts on this blog are opinions, not advice. Please read our Disclaimers.

Defending with S&P Dividend Aristocrats

How do S&P Dividend Aristocrats respond to volatility, inflation and rising rates? S&P DJI’s Pavel Vaynshtok and ProShares’ Simeon Hyman take a closer look at how these quality dividend growers have performed in different market environments.

The posts on this blog are opinions, not advice. Please read our Disclaimers.

These Go to 11: Diversification with S&P 500 Sectors

Contributor Image
Joseph Nelesen

Senior Director, Index Investment Strategy

S&P Dow Jones Indices

Many strategies (including passive ones) hold large allocations to Information Technology. A “barbell” approach can mitigate risk from high exposure to one sector by pairing it with another.

Do you remember sending your first email? For many, it was likely around the mid-1990s when a “googol” was still 10^100 rather than a verb and the @ key on your keyboard was seldom used. The world has changed indeed. In 1995, the Information Technology sector comprised just 10% of the S&P 500® but soon rocketed to 35% by March 2000 before a bursting bubble started its Icarian descent back below 20% (see Exhibit 1). By 2021, Information Technology reached a peak weight of 29% as the largest of the 11 S&P 500 sectors before leading the market downward this year.

Because each S&P 500 sector uses the Global Industry Classification Standard® (GICS®) to group businesses that are similar, sectors tend to exhibit non-aligned periods of outperformance. On any given day since December 2000, 51% of sectors have outperformed over a trailing six-month period. We find that whenever Information Technology has underperformed the S&P 500 during a six-month period, all 10 other GICS sectors have, on average, outperformed the benchmark (see Exhibit 2).

A recent example of sectors exhibiting different performance profiles can be seen in Energy and Information Technology since the emergence of COVID-19 in December 2019 (see Exhibit 3). While Information Technology has exhibited defensive resilience during pandemic-related tumult, it has traditionally been viewed as a more cyclical sector that benefits from periods of economic strength and market optimism toward future earnings, Energy tends to be a necessary purchase for consumers and businesses throughout the economic cycle (barring pandemic-driven reduced fuel demand). Some investors may eschew Energy when Information Technology is on the rise, but it has demonstrated usefulness as a diversifier of risk and return.

Historically, combining the Information Technology sector with less-correlated sectors has reduced risk and aided long-term performance. For illustration, we constructed an equal-weighted three-sector hypothetical blend of the S&P 500 Information Technology, S&P 500 Energy and S&P 500 Consumer Staples (rebalanced monthly) and compared it with the performance of the S&P 500 Information Technology alone during the first year of the 2000 dot-com crash as well as during the YTD 2022 downturn (see Exhibit 4).

Extending the study period of the three-sector blend since 2000, we find that the combination of the three-sector blend not only exhibited similar annualized volatility (19.33%) to the S&P 500 (19.61%) but also produced higher cumulative return (578.06%) than the S&P 500 (374.19%) as well as the individual sector components thanks to diversification and regular rebalancing.

Although the path of any individual sector over time can be difficult to predict, data suggest that long-term diversification qualities among the S&P 500 sectors have been robust. If one sector bet goes wrong, others tend to go right. With 11 sectors to choose from, investors are equipped with time-tested tools to make thoughtful pairings and navigate their investing strategies through the cycle.

The posts on this blog are opinions, not advice. Please read our Disclaimers.

The S&P MidCap 400: An Overlooked Gem

Contributor Image
Fei Wang

Senior Analyst, U.S. Equity Indices

S&P Dow Jones Indices

The S&P MidCap 400® is an often-overlooked member of the S&P Composite 1500® series, despite outperforming the S&P 500® and S&P SmallCap 600® since 1994 (see Exhibit 1).1 The mid-cap U.S. equity index also weathered the market volatility slightly better during the first five months of 2022 by falling less than 11%, compared to a near 13% decline for the S&P 500 and more than 11% for the S&P SmallCap 600.

The S&P MidCap 400 is not the only index designed to represent the performance of mid-cap U.S. equities; the Russell Midcap Index also tracks this segment. Exhibit 2 shows that the S&P 400® has outperformed the Russell Midcap Index since 1994. Such outperformance has also been observed so far this year, with the S&P 400 beating the Russell Midcap Index by 1.9% through the end of May 2022. So, what helps to explain this difference?

As we have pointed out before, the S&P Composite 1500 series is constructed differently than the Russell 3000. One of the major differences is that the S&P Composite 1500 uses an earnings screen, which impacts the selection of companies in the indices. Exhibit 3 shows the results from a 2-Factor Brinson Attribution analysis by GICS® sectors between the S&P MidCap 400 and Russell Midcap Index from Dec. 31, 2021, to May 31, 2022.

The results show that the choice of constituents (selection effect) drove the S&P 400’s outperformance during the first five months of 2022, particularly in the Information Technology, Financials and Health Care sectors. Differences in sector weights (allocation effect) slightly detracted from relative returns. The S&P 400’s lower weight in Energy helped to explain this result.

Another important difference between the two indices is they have different size exposures. For example, Exhibit 4 shows that more than 50% of iShares Russell Midcap ETF’s weight fell in the largest size quintile at the end of 2021. The S&P 400 had no exposure to these companies, which helped its relative performance in the first five months of 2022. The S&P 400 also benefited from its greater exposure to the smallest size quintile.

Overall, the S&P 400’s recent returns highlight the potential benefit of mid-cap U.S. equities—the index outperformed the S&P 500 and S&P SmallCap 600 since 1994, and YTD in 2022. The S&P 400’s outperformance compared to the Russell Midcap also demonstrates the importance of index construction and the potential impact on stock selection and size exposure.


1 For more information, see Bellucci Louis, Hamish Preston and Aye M. Soe. “The S&P MidCap 400: Outperformance and Potential Applications.” S&P Dow Jones Indices. June 2019.

The posts on this blog are opinions, not advice. Please read our Disclaimers.

Index-Based Tools for Tracking the Future

Get to know the S&P Kensho New Economy Indices, a comprehensive, rules-based, thematic index framework powered by AI and designed to help investors better understand and precisely measure the long-term transformative trends and exponential innovation and growth of the sectors and industries driving the Fourth Industrial Revolution.

Learn more: New Economies – Investment Themes | S&P Dow Jones Indices (spglobal.com)

The posts on this blog are opinions, not advice. Please read our Disclaimers.