Get Indexology® Blog updates via email.

In This List

Seeking Sustainable Dividends in Global Markets – Introducing the Dow Jones International Dividend 100 Index (Part 1)

Expanding the Non-USD Denominated S&P GSCI Single Commodity Index Series

Global Islamic Indices Advanced in Q1 2021, but Lagged Conventional Counterparts

Beyond Market Cap: A Custom Index Approach to Australia

One Year after the Rapid Reset

Seeking Sustainable Dividends in Global Markets – Introducing the Dow Jones International Dividend 100 Index (Part 1)

Contributor Image
Qing Li

Director, Global Research & Design

S&P Dow Jones Indices

Dividend strategies appeal to investors for various reasons. High-dividend-yield strategies can offer generous income, while dividend growth strategies tend to emphasize the quality of dividends. The Dow Jones International Dividend 100 Index, launched in March 2021, seeks to provide global exposure to both high dividend yield and dividend growth.

Here we review the methodology of this index’s construction. The Dow Jones International Dividend 100 Index is comprised of non-U.S. large- and mid-cap companies that exhibit consistent dividend payout history, strong fundamentals, and relatively low volatility. Exhibit 1 outlines the key process of the index construction, which involves multi-layered screens to incorporate various factors.

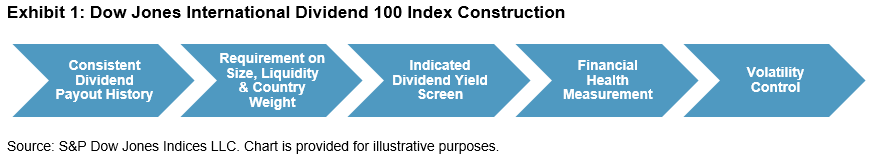
The initial universe consists of the large- and mid-cap issues1 from the Dow Jones Global ex-U.S. Index. Additional parameters (see Exhibit 2) are applied to form a selection universe.

After this screening, only the securities whose indicated dividend yields ranked among the top half of those considered are qualified for further financial health evaluation. The subsequent measurement is a composite score combining cash flow-to-debt, return on equity (ROE), indicated dividend yield, and the five-year dividend growth rate.

Cash flow-to-debt indicates the efficiency level of a company in producing cash to cover its debt. As a profitability ratio, ROE signifies how well a company is using its shareholders’ capital, and a company with higher ROE is more capable of cash generation. The use of indicated dividend yield reflects expected income2 rather than realized income that an investor will receive. While indicated dividend yield represents cash income, dividend growth rate helps determine if a company can sustain its long-term dividend distribution. We define the dividend growth rate as the percentage rate of growth of a company’s annualized dividend per share over the past five years. Analyzing these fundamentals can help investors gauge a company’s financial health.

The composite score is calculated as the average rank of the four fundamental-based factors. A high composite score means a company is financially healthy. Based on the composite score, the top 400 securities are selected for volatility screen, where volatility is calculated as the three-year price volatility in USD. The initial portfolio is formed with the top 100 ranked stocks whose volatilities are less than or equal to the median volatility of the 400 top-scoring stocks.

The index is float-market-cap weighted, with various weight constraints to reduce concentration risk. During the annual March rebalancing and quarterly updates, the weightings are evaluated to ensure that a security only represents a maximum 4% of the index, each of the Global Industry Classification Standard (GICS®) sectors are capped at 15%, and the emerging market exposure is limited at 15%. In addition, the index is subject to a daily weight cap check when the sum of the stocks whose weights are greater than 4.7% exceeds 22%.

To reduce turnover, buffer rules3 that favor the existing index members are applied in multiple layers during the selection process, including buffer zones on size, country weight, indicated dividend yield, volatility, and count.

The Dow Jones International Dividend 100 Index adds a multi-level process to the rule-based framework. In our next blog, we will analyze how this index has performed.


1 REITs are excluded. For China, only the shares that trade in developed markets are eligible.

2 Using Trailing Dividend Yield Versus Indicated Dividend Yield

3 Please refer to the Dow Jones Dividend Indices Methodology for details.

The posts on this blog are opinions, not advice. Please read our Disclaimers.

Expanding the Non-USD Denominated S&P GSCI Single Commodity Index Series

Contributor Image
Jim Wiederhold

Former Director, Commodities and Real Assets

S&P Dow Jones Indices

Concerns of a rising U.S. dollar may pose a hindrance to initiating commodity exposure from outside the U.S. Most commodities around the world are priced in U.S. dollars, so when the value of the U.S. dollar rises, the value of commodities typically falls. The launch of new non-U.S.-dollar-denominated S&P GSCI Single Commodities Indices could help commodity exposure seekers gain access while alleviating the external currency risk. Exhibit 1 shows the newly expanded universe of the S&P GSCI Single Commodities Index offerings. These indices are designed to track commodities from exchanges outside of the U.S. and are priced in currencies of the home countries.

These indices not only offer a non-U.S. dollar exposure to natural resources, but also assist with the financialization of alternative commodities markets, some of which are completely new, and others that are alternatives to more-established futures markets. Exhibit 2 illustrates the 2021 YTD performance of many of these commodities.

There are good reasons for the recent excitement around these commodities. Several of these commodities are used in renewable diesel applications. Fiona Boal, Head of Commodities and Real Assets at S&P DJI, wrote a twopart blog series discussing the expanding interest in these non-fossil-fuel inputs to renewable energy. Several other of these indices expand the geographic footprint and offer alternatives to the more well-known commodities like gold, corn, and natural gas that are traded on U.S. exchanges. The Tokyo-, London-, Saskatchewan-, Paris-, and Kuala Lumpur-based futures offer commodity participants exposure outside of traditional U.S.-based markets.

Tactically allocating to individual commodities when conditions are ripe has historically only been within the realm of a small group of domain expert traders. But as the broad cohort of market participants becomes more sophisticated and access to alternative asset classes improves, it is possible that the tactical allocation to commodities will expand. Commodities can be used as building blocks to express thematic macro plays and can easily be traded due to highly liquid and robust markets. Commodities also benefit from being equally tradeable, in both long and short positions. Single-commodity indices tracking front-month futures contacts provide the opportunity to access this market on the long or short side.

Check out our new website celebrating 30 years of the S&P GSCI and our newly published thought leadership paper looking at what the next 30 years might have in store for commodities.

The posts on this blog are opinions, not advice. Please read our Disclaimers.

Global Islamic Indices Advanced in Q1 2021, but Lagged Conventional Counterparts

Contributor Image
John Welling

Senior Director, Head of Global Equity Indices

S&P Dow Jones Indices

Global equities continued to rise during Q1 2021, gaining 2.5%, as measured by the S&P Global BMI. Shariah-compliant benchmarks, including the S&P Global BMI Shariah and Dow Jones Islamic Market (DJIM) World Index, underperformed their conventional counterparts in Q1, in part due to the strong performance of the Financials sector, which gained nearly 12% during the period. Apart from Asia Pacific, all regional Shariah and conventional benchmarks returned positive performance during the quarter.

Sector Drivers Led to Quarterly Underperformance

While global equities largely recovered from the global market sell-off of 2020, sector performance continued to vary widely into the first quarter of 2021. Although Energy led Q1 sector performance, its small weight had little impact on overall returns. Meanwhile, Financials—which is nearly absent from Islamic indices—heavily outperformed the broader market, and Information Technology—which tends to be overweight in compliant indices—underperformed on a relative basis. These two sectors, along with Health Care, accounted for a large majority of the Shariah underperformance during the quarter.

Exhibit 2 displays sector returns along with the effect of over- and under-weight sector allocations of the S&P Global BMI Shariah compared to its conventional counterpart. Over half of the S&P Global BMI Shariah underperformance during the period—1.5%—is explained by differing sector allocations, while 1.2% is explained by the inclusion process of individual Shariah-compliant stocks.

MENA Equities in Recovery

MENA regional equities gained considerably during Q1, as the S&P Pan Arab Composite advanced 12.4%. The S&P Saudi Arabia BMI led the way in the region, gaining 16.1%, followed by the S&P UAE, up 14.14%. Notably, the S&P Pan Arab Composite Shariah surpassed its conventional counterpart by 2.3% during the quarter, in large part due to significant representation of Saudi Arabia, which outshone regional peers.

For more information on how Shariah-compliant benchmarks performed in Q1 2021, read our latest Shariah Scorecard.

This article was first published in IFN Volume 18 Issue 15 dated the 14th April 2021

The posts on this blog are opinions, not advice. Please read our Disclaimers.

Beyond Market Cap: A Custom Index Approach to Australia

How are Custom Indexing tools helping Australian investors plan for superannuation and optimize broad market exposure? Take a closer look at the design process, objective, and performance of the Hamilton12 Australian Diversified Yield Index with S&P DJI’s Kenny Chan and Hamilton12’s Jason Hall.

The posts on this blog are opinions, not advice. Please read our Disclaimers.

One Year after the Rapid Reset

Contributor Image
Jim Wiederhold

Former Director, Commodities and Real Assets

S&P Dow Jones Indices

What a difference a year makes. April 21, 2021, marks the one-year anniversary of the S&P GSCI’s low. Since then, we have entered a different economic, social, and geopolitical environment, and the S&P GSCI was up 60% as of April 19, 2021. On March 26, 2020, three days after the low in the S&P 500®, I wrote a blog called Rapid Reset, discussing the market sentiment, what to look for in the short term, and potential structural shifts in commodities markets. This included the potential for a peak in commodities supply after many years of gluts in most commodities. Since this time last year, a dramatic reduction in oil production, loss of agriculture crop supply, and huge draws on industrial and precious metals coalesced to push commodities prices in some cases to new all-time highs. With changes in market dynamics, highly volatile scenarios played out, and the start of the 2020s displayed some of the highest volatility in recent history.

How have the commodities markets shifted to start this new decade? Themes that played out in the 2010s seem to have either hit the brakes or accelerated over the past year. The most prominent change involved energy. One year out from front-month futures crude oil prices dipping into negative territory, it seems unlikely that the oil producers still in business will ever again pump oil without regard for systemic macroeconomic risks. U.S. shale producers just posted the most bankruptcies for a first quarter since 2016, despite crude oil prices being up 30% YTD. With a global focus on green infrastructure and battling climate change, the energy transition has commenced. The world may never again be “swimming in oil.” Electric vehicles are a major driver behind the energy transition, as demand for fossil fuels will likely decrease over the long run. With more and more countries committing to carbon-neutral timelines, oil companies will have to adapt to stay relevant. Exhibit 2 shows the latest country net-zero and emissions targets compiled by S&P Global Platts, a division of S&P Global.

The last quarter of 2020 also marked a turning point in the grains market. For the first time in years, we witnessed a surprise to the downside in grain production in the western hemisphere. Several factors including weather events, farmers reducing acreage due to low prices, and lack of government subsidy assistance all played a role in this bullish supply-driven story. At the end of March 2021, market participants were surprised again by the USDA releasing a dramatically lower-than-expected reading for U.S. grain plantings this season. The tailwinds continued for the grain sector as corn and soybeans made new five-year highs.

Finally, industrial metals continued their bullish path off the lows and showed how closely tied they are to the post-pandemic economic recovery. Metals have an added benefit from the demand side, as most traded metals are used in some form or capacity in clean energy technologies.

April marks the 30-year anniversary of the S&P GSCI, the premiere global production-weighted benchmark for commodities. The S&P GSCI has stood the test of time and remains the global benchmark most closely tied to inflation and global economic growth.

The posts on this blog are opinions, not advice. Please read our Disclaimers.