Get Indexology® Blog updates via email.

In This List

Elevated Volatility Levels in Sectors Remain

Highlights of the SPIVA Canada Year-End 2020 Scorecard

SPIVA and Style

The Case for The S&P 500 GARP Index

SPIVA U.S. Year-End 2020 Scorecard: Passive Continued Its Winning Streak

Elevated Volatility Levels in Sectors Remain

Contributor Image
Fei Mei Chan

Former Director, Core Product Management

S&P Dow Jones Indices

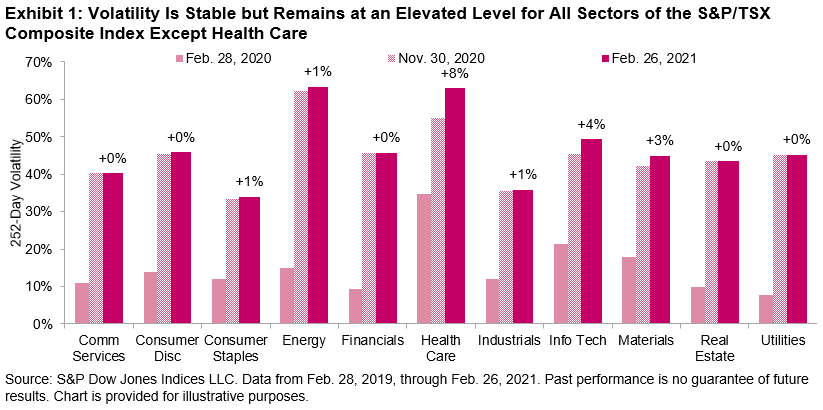
The shock that the onset of the pandemic sent through the financial markets a year ago is mostly a distant memory. The S&P/TSX Composite Low Volatility Index was up 34% for the one-year period ending March 19, 2021, lagging its benchmark index. This is not surprising given that the performance of the S&P/TSX Composite Index has been spectacular, up 60% over the past year (from the lows of the pandemic-related panic last March). Volatility at the sector level, though, remains elevated.

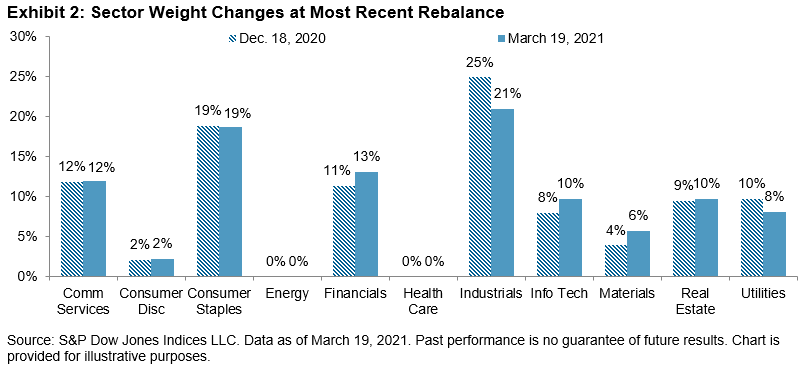
The S&P/TSX Composite Low Volatility Index rebalanced following the close of trading on March 19, 2021, and the changes were minor. But the results of this rebalance point to more idiosyncratic dynamics that may be happening at the stock level. Despite a 3% increase in volatility for the Materials and Information Technology sectors, the low volatility index increased weight in both sectors, while scaling back on Industrials and Utilities. There were only three name changes of the 50 companies in the index.

The posts on this blog are opinions, not advice. Please read our Disclaimers.

Highlights of the SPIVA Canada Year-End 2020 Scorecard

Contributor Image
Berlinda Liu

Former Director, Multi-Asset Indices

S&P Dow Jones Indices

Although 2020 was a year that offered ample opportunities for stock pickers to shine, most Canadian active fund managers in five of the seven categories tracked by the SPIVA® Canada Year-End 2020 Scorecard underperformed their benchmarks over the past year.

The Canadian equity market was not spared from the COVID-19 shock in 2020. Nevertheless, major local equity benchmarks finished positive, with the exception of the S&P/TSX Canadian Dividend Aristocrats® Index. Among actively managed Canadian equity funds, 88% lagged the S&P/TSX Composite Index. Canadian Small-/Mid-Cap Equity funds had a banner year, as just 22% failed to beat the S&P/TSX Completion Index. Canadian Dividend & Income Equity funds took second place among fund categories, with just 44% lagging the S&P/TSX Canadian Dividend Aristocrats Index.

Results were more uniform and bleaker over longer horizons. At least 84% of funds underperformed their benchmarks in all but one category over the past decade.

Equity funds looking outside of Canada performed better than their domestic-focused peers on an absolute return basis, but still generally underperformed the benchmarks. Thanks to a strong rebound in the U.S., equity funds there posted the highest returns over the past year among all categories, with a 13.6% gain on an equal-weighted basis. However, this was still below the 16.3% return of the S&P 500® (CAD), and 69% of the funds still fell short of their benchmark.

Larger funds in Canada tended to outperform their smaller counterparts, as 22 of the 28 results showed higher asset-weighted returns across the seven fund categories and four investment horizons in the report.

The data from the SPIVA Canada Year-End 2020 Scorecard show disappointing performance of active funds relative to their respective benchmarks. Over the past decade, most funds in all categories failed to beat index investing.

The posts on this blog are opinions, not advice. Please read our Disclaimers.

SPIVA and Style

Contributor Image
Craig Lazzara

Former Managing Director, Index Investment Strategy

S&P Dow Jones Indices

Last week S&P Dow Jones Indices released its SPIVA® U.S. Year-End 2020 Scorecard. As has been the case for 17 of the past 20 calendar years, the majority of active large-cap managers underperformed the S&P 500®. Performance was better for mid- and small-cap managers, as Exhibit 1 shows. What caused the advantage for smaller-capitalization strategies?

Style bias supplies part of the answer. We refer to “style bias” as any systematic tendency in an actively-managed portfolio. For example, if a portfolio habitually tilts toward growth stocks, we’d refer to this tilt as a growth bias. (This is different from making tactical allocations between growth and value, depending on a manager’s judgment of their relative attractiveness.) One of the most important style biases concerns the size of companies in an active portfolio relative to its benchmark index.

Simple as it seems, style bias has much to say about active management. Exhibit 2 examines quarterly data on the relative performance of the S&P 500 and the S&P MidCap 400. Of 76 quarters between 2002 and 2020, the S&P 400TM outperformed the S&P 500 in 42. In those quarters, a majority of large-cap managers outperformed the S&P 500 15 times for a 36% hit rate. In contrast, in the 34 quarters when the S&P 500 beat the S&P 400, the frequency with which most large-cap managers outperformed fell to 12% (4/34).

We see an analogous effect among mid-cap managers, as shown in Exhibit 3. When the S&P 400 outperformed the S&P 500, the frequency with which most mid-cap managers outperformed was 24% (10/42). When the S&P 500 dominated, however, the likelihood that a majority of mid-cap managers would outperform was 59% (20/34).

Historically, large-cap managers perform better when mid-cap stocks beat large caps, and mid-cap managers perform better when large caps beat mid-caps. These results suggest that the average large-cap manager has a small-cap tilt relative to his benchmark, while the average mid-cap manager has a larger-cap tilt. These inferences, which are quite reasonable, help explain SPIVA’s 2020 results. Smaller-cap managers could add value by moving up the capitalization scale. No such reprieve was available to large-cap managers last year.

The posts on this blog are opinions, not advice. Please read our Disclaimers.

The Case for The S&P 500 GARP Index

Contributor Image
Wenli Bill Hao

Director, Factors and Dividends Indices, Product Management and Development

S&P Dow Jones Indices

The S&P 500® GARP (Growth at a Reasonable Price) Index just had its second anniversary since its launch in February 2019. During the latter half of this time, the world experienced the worst global pandemic in a century. Equities entered a swift V-shaped bear market and rebound.

In this blog, we review the index’s performance, characteristics, and relevant single-factor strategies.

Performance

During the past one-year period, the S&P 500 GARP Index outperformed the S&P 500 and other selected single-factor indices by a wide margin. For the overall post-launch two-year period, the S&P 500 GARP Index again outperformed the S&P 500 and other selected single-factor indices, with the exception of the S&P 500 Pure Growth.

Rebasing the S&P 500 GARP Index, its associated single factor indices, and the S&P 500 to 100 on Feb. 28, 2019, the S&P 500 GARP Index, S&P 500 Quality Index, S&P 500 Enhanced Value Index, and S&P 500 Pure Growth reached 142.3, 141.9, 115.5, and 148.1, respectively, on Feb. 26, 2021, while the S&P 500 reached 142.0 (see Exhibit 1).

The outperformance of the S&P 500 GARP Index mainly came from the most recent 12-month period. During this time, the S&P 500 GARP Index outperformed the S&P 500 and selected single-factor indices, as shown in Exhibit 2.

Such results are not surprising given recent market development. First, with the vaccination rollout and decrease in new COVID-19 cases, investors expect real economic recovery on the horizon. Second, as yields of longer-term U.S. government bonds tick up, investors may start to rotate out of expensive growth stocks and favor value companies.

Strategy Characteristics

The S&P 500 GARP Index is designed to track growth companies with relatively high quality and good valuation. It aims to balance pure growth and pure valuation exposures, as the former tends to target high-growth, yet expensive stocks, while the latter may take a longer time to pay off.1

To achieve its goal, the S&P 500 GARP Index selects stocks using two layers of filters:2 a growth style and a composite style of quality and value (QV). Stocks are first ranked by growth z-scores, with the top 150 stocks remaining eligible for index inclusion. Then, these stocks are ranked by QV composite z-score. The top 75 stocks are selected and form the index. The factors used in the index design are shown in Exhibit 3.

Factor Exposure

Using the risk factors from a commercial risk model, we present the active exposures3 of four factors. The definitions of the four factors are in line with those used in the S&P 500 GARP Index. In comparison with the S&P 500, the GARP strategy has higher exposures to earnings, sales growth, earnings yield, and profitability,4 and lower exposures to leverage (see Exhibit 4). The factor exposure results align with the objective of the index design.

Conclusion

Aiming to balance pure growth and pure valuation exposures, the S&P 500 GARP Index selects growth stocks with relatively high quality at a reasonable price. Factor exposure analysis shows that the index’s multi-factor sequential filtering approach achieves its design objective. Moreover, during the post-launch period, the GARP strategy had better returns than the S&P 500 and other relevant single-factor indices, except the S&P 500 Pure Growth. The current market environment may present an opportunity for investors to consider the S&P 500 GARP Index as they diversify away from expensive pure growth stocks.

1 Refer to Indexing GARP Strategies: A Practitioner’s Guide for strategy rationale, designs, and attribution analysis.

2 See the S&P 500 GARP Index Methodology for more information.

3 Active factor exposure is defined as the strategy factor exposure minus the benchmark factor exposure.

4 Refer to Axioma United States Equity Factor Risk Models for more information about factor definitions.

The posts on this blog are opinions, not advice. Please read our Disclaimers.

SPIVA U.S. Year-End 2020 Scorecard: Passive Continued Its Winning Streak

Contributor Image
Berlinda Liu

Former Director, Multi-Asset Indices

S&P Dow Jones Indices

In a year that brought a pandemic, volatility, and policy stimulus, asset prices rose nearly across the board. However, positive absolute returns did not necessarily translate into success for active managers relative to their benchmarks. According to the SPIVA® U.S. Year-End 2020 Scorecard, most active fund managers in the U.S. underperformed their benchmarks over the past year. Among actively managed domestic equity funds, 57% lagged the S&P Composite 1500® in 2020, marking the seventh consecutive year in which a majority of U.S. active equity managers underperformed.

For the 11th consecutive one-year period, the majority (60%) of large-cap funds underperformed the S&P 500®. Mid-cap (51%) and small-cap (46%) funds did somewhat better relative to the S&P MidCap 400® and S&P SmallCap 600®, respectively. As we observed in our 2020 mid-year report, the performance divergence among different categories diminished as the time horizon lengthened. Over the past 20 years, more than 88% of U.S. equity funds failed to beat their benchmarks across all three market capitalization segments.

Growth funds dominated their value peers in 2020. As shown in Exhibit 2a and 2b, the equally weighted average return of all large-cap growth managers was 36.7%, approximately nine times the equally weighted average return generated by all large-cap value managers. However, the advantage of growth funds narrowed over time; there was little difference across the 20-year horizon. More importantly, longer term results showed little difference in funds’ performance relative to their benchmarks. Most funds in both categories underperformed in all periods longer than five years.

The data from the SPIVA U.S. Year-End 2020 Scorecard show a continued winning streak for passive investment. Even the few short-term active bright spots tended to lag their benchmarks over the long term. Across all capitalizations and investment styles, the most probable path for short-term outperformance is to fall short of benchmark returns eventually.

The posts on this blog are opinions, not advice. Please read our Disclaimers.