Get Indexology® Blog updates via email.

In This List

What Would Emerging Markets Be Without China?

Comparing Defensive Factors During the Last 3 Bear Markets

Why S&P 500 and DJIA Futures Could Be Useful for Asian Investors during the COVID-19 Selloff

Courage vs. Comfort

The S&P Global REIT QVM Multi-Factor Index Part II – Performance, Country Composition, and Factor Exposure

What Would Emerging Markets Be Without China?

Contributor Image
Sherifa Issifu

Senior Analyst, U.S. Equity Indices

S&P Dow Jones Indices

In the first decade of the 2000s, the U.S. and other developed countries fell behind emerging market equities by a wide margin, and they lagged China’s markets in particular: the S&P China BMI grew by 600% in the first decade of the new millennium. The 2010s saw a reversal of fortunes for broad-based emerging market equities, with the U.S. leading developed markets to strong outperformance over the decade.

The first quarter of 2020 was marked with record levels of volatility in response to the COVID-19 pandemic, followed by a sharp recovery in the U.S. as the S&P 500® experienced both its shortest bear market and its fastest return to new highs.

But while the S&P 500 is now up a healthy 6% YTD, the S&P Emerging BMI is essentially flat, with a total return in U.S. dollars of -0.06% (as of Sept. 14, 2020). The index’s performance masks a wide dispersion of returns among its constituents: a 53% spread separates the top performer, China, from bottom-of-the-pack Colombia. Few markets have begun the decade with gains: in fact, only China and Taiwan are in the green for 2020.

Thanks in part to such strong recent performance, China has now become as important to the emerging markets as the U.S. is to developed markets, if not even more. China has come to represent nearly 50% of the S&P Emerging BMI by weight—with China’s weight helped by the broader A-shares universe, which was included in the benchmark in 2019 at a partial inclusion factor of 25%.

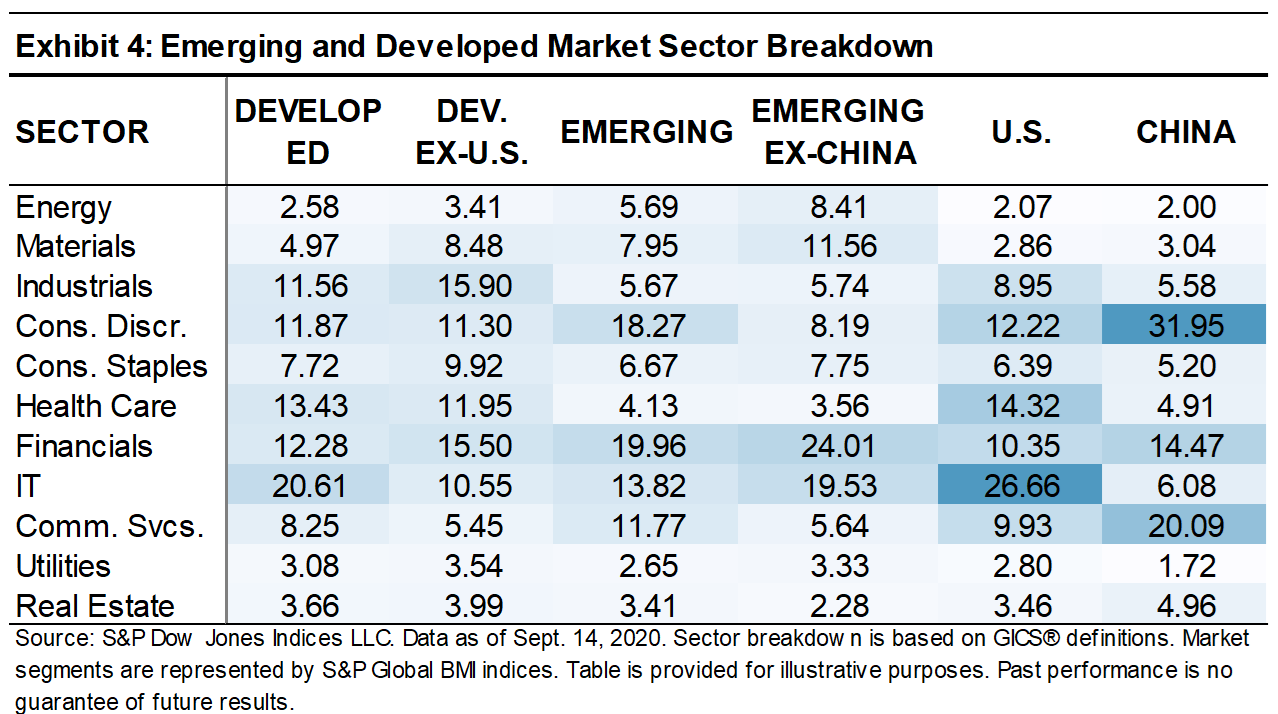
While China’s role in emerging markets may mimic U.S. dominance of the developed markets, from a sectoral perspective there are both similarities and differences. The U.S.’s sizeable ~27% weighting to the IT sector is its largest, while China’s biggest sectors are Consumer Discretionary and Communication Services—which together account for more than 50% (see Exhibit 4).

However, the differences in sector weights disguise a further commonality: dominating China’s largest sectors, Alibaba and Tencent are, respectively, broadly comparable in both relative size and business activities to Amazon and Alphabet (parent company of Google). These mega-cap tech-related firms have seen large outperformance in comparison to other sectors and the rest of the world, putting them in the driver’s seat of their respective local markets and striking a common chord between the U.S. and Chinese markets.

The path for China in 2020 and beyond remains uncertain. But what is clear is that a view on emerging markets requires careful consideration of the allocation made to—and the prospects for—Chinese stocks. You can learn more about S&P DJI’s range of global equity benchmarks here.

The posts on this blog are opinions, not advice. Please read our Disclaimers.

Comparing Defensive Factors During the Last 3 Bear Markets

Contributor Image
Andrew Neatt

Private Investment Advice

TD Wealth

In the factor world of investing, Low Volatility and Quality have been commonly referred to as defensive factors.  The following is an examination of the performance of the S&P 500 Quality Index and the S&P 500 Low Volatility Index compared to the S&P 500 during the last 3 equity bear markets.  The graphs and data in this report are generated from the Optimal Asset Management’s Factor Allocator Tool.

Before we examine this performance it is important to understand why Quality and Low Volatility have been considered defensive factors.  There are multiple reasons why they have been considered defensive but here are three good reasons.  First of all, they have historically exhibited less volatility as measured by standard deviation on a consistent basis.  The graph below compares the annualized volatitity over the past 1, 3, 5, and 10 year periods ending July 31, 2020 of the S&P 500 Index, S&P 500 Quality Index, and S&P 500 Low Volatility Index.

Another reason is that over the long term, the maximum drawdown of each of these indices has not matched the extent of the maximum drawdown experienced by the S&P 500 as shown in the table below (period examined is from January 3, 1995 to July 31, 2020):

A third reason, on average the S&P 500 Quality Index and the S&P 500 Low Volatility Index have outperformed the S&P 500 during the worst equity market regimes.  To support this point, the following graph shows the average quarterly excess returns of the S&P 500 Quality Index and S&P 500 Low Volatility Index compared to the S&P 500 Index over a variety of market regimes ranging from the worst bear markets to the best bull markets during the period of January 3, 1995 to July 31, 2020.

At the time of writing we are currently at or near all-time highs for the S&P 500 only a few months after the most recent equity bear market low so it is timely to compare the performance of these defensive factors during this year’s equity bear market to the previous two equity bear markets.

Each of the following three bear market comparisons examine the performance over an 18-month period that include similar time frames pre and post equity market low.  For example, the 2002 analysis includes 88 days of recovery after the low of 2002, the 2009 analysis includes 116 days of recovery after the low of 2009, and the 2020 analysis includes 102 days of recovery after the most recent low.

First, the following is a look at the equity bear market of 2002:

Next,  a look at the 2009 equity bear market:

Finally, the most recent bear market:

After examination of these three tables, one can see the consistent reduced volatility associated with the S&P 500 Quality Index and the S&P 500 Low Volatility Index compared to its parent benchmark, the S&P 500 in the past 3 bear markets.  When it comes to returns, the S&P 500 Low Volatility Index and the S&P 500 Quality Index both outperformed in 2002 and 2009.  However, in 2020, while the S&P 500 Quality Index outperformed the S&P 500 again, the S&P 500 Low Volatility Index underperformed.

The posts on this blog are opinions, not advice. Please read our Disclaimers.

Why S&P 500 and DJIA Futures Could Be Useful for Asian Investors during the COVID-19 Selloff

Contributor Image
Izzy Wang

Senior Analyst, Factors and Dividends

S&P Dow Jones Indices

The co-movement of returns that emerged from the interconnection of global markets has important consequences in terms of portfolio hedging and risk management. In our paper, Regional Relevancy of S&P 500® and Dow Jones Industrial Average Futures® in Asia, we highlighted three characteristics of S&P 500 and Dow Jones Industrial Average (DJIA®) futures could potentially be beneficial for Asian investors:

  1. High Liquidity during Asian Trading Hours:1 About USD 27.4 billion in S&P 500 and DJIA futures were traded daily during Asian hours as of June 23, 2020;
  2. High Correlation with Asian Markets: Correlations between U.S. and Asian markets tend to be as high as intraregional correlations in Asia, and they tend to increase during periods of high volatility; and
  3. High Flexibility in Trading: Nearly 24-hour trading and a wide variety of contract sizes allow for precise exposure adjustment at any time.

The high liquidity during Asian trading hours and high correlation with Asian markets could help investors to realize key potential advantages of having U.S. benchmark futures trade during Asian trading hours: being able to react globally to major market news as it happens, hedge against geopolitical uncertainties, and adjust accordingly ahead of economic releases and announcements.

Historically, major market events tend to amplify the liquidity of S&P 500 and DJIA futures, indicating their importance when investors want to react to market news in a timely fashion. On the night of the 2016 U.S. presidential election when U.S. ETF and stock markets were closed, S&P 500 futures traded a notional value of USD 264 billion. This blog provides a recent example of S&P 500 and DJIA futures during an extreme period by focusing on the COVID-19 selloff.

For the whole selloff period from Feb. 19, 2020, to March 23, 2020, the average value traded2 in S&P 500 and DJIA futures was about USD 51.9 billion during Asian trading hours per day (see Exhibit 1). Of note is that on Black Thursday (March 12, 2020), the value traded in S&P 500 futures climbed to USD 77.3 billion during Asian trading hours, which was almost double its average for the selloff period, far exceeding the liquidity traded in the major Asian benchmark futures.

Looking closer at each hour on March 12, 2020 (see Exhibit 2), we can see investors’ immediate reactions to market news through the liquidity of S&P 500 futures. There were two major shocks that largely contributed to Black Thursday. First, when Trump announced a 30-day travel ban against Europe around 9:00 am (Hong Kong/Singapore Time), there was a boost in the value traded of S&P 500 futures. Then later that day, when the ECB made it clear it would not cut interest rates, the value traded in S&P 500 futures increased significantly alongside the effect of the U.S. market open.

The high level and substantial increase in liquidity during major market events suggests the importance of S&P 500 and DJIA futures as one of the most popular instruments for investors to react timely to market news. Combined with the nearly 24-hour trading and a wide variety of contract sizes, market participants in Asia can potentially hedge and manage risk effectively using a single liquid U.S. index derivative instrument.

1 For the purposes of this paper, Asian trading hours are defined as 8:00 a.m. to 5:00 p.m. Singapore/Hong Kong time.

2 The daily value traded associated with each futures trade is calculated as the number of contracts traded per day times the futures VWAP price per day times the contract size.

The posts on this blog are opinions, not advice. Please read our Disclaimers.

Courage vs. Comfort

Contributor Image
Craig Lazzara

Former Managing Director, Index Investment Strategy

S&P Dow Jones Indices

Philosophers have long argued that courage is the most essential human virtue, because without courage, all other virtues lie in jeopardy. Remarkably, the theorizing of ethicists has an implication for practical portfolio management.

We can illustrate this with a simple example in Exhibit 1. It’s Dec. 31, 1999, and a professional investor is considering buying four different stocks for his clients’ portfolios. He obtains (never mind how; read the paper) correct data on the future volatility of the four candidates. All four possible purchases are more volatile than the market as a whole, but stocks A and B appear especially so.

Our investor has confidence in the analysts who recommended all four investments, and realizes that volatility is the price you sometimes must pay to earn the stock market’s long-run returns. But he’s also mindful that positions in stocks A and B, in particular, might produce some very uncomfortable client meetings. When the $1,000 he invested in stock A is worth only $275, will he still have confidence in his analyst’s recommendation? More urgently, will his clients still have confidence in him? The volatility data make it clear that, regardless of the long-run outcome, stocks C and D will be much more comfortable holdings than A and B.

And this, as Exhibit 2 makes clear, is the problem. Stock A is Apple, which turned out to be the best performer in the S&P 500® for the 20 years ended December 2019. Stock B is Amazon, which lagged Apple but still beat the market handily. Stocks C and D, the comfortable choices, both underperformed the S&P 500. Pity our poor manager: the stocks that would have been easy to hold, and make for relatively stress-free client meetings, ultimately underperformed. The two winners, which would surely have enhanced his reputation as an astute stock picker, would have done the opposite.

Anyone conversant with our SPIVA® scorecards will realize that the average active manager fails most of the time. Why should this be? Active managers are smart, hard-working, well-trained, and highly motivated; the qualities that typically lead to success seem to avail relatively little. We have previously enumerated some of the reasons for active failure—for example, the professionalization of investment management, or the skewness of equity market returns. The simple example here adds another challenge to this list.

One of the reasons that active management is so difficult is that the correct investment choice may not be the easy choice. The challenge for an active manager is not limited to identifying the relatively small number of long-term winners. Success also requires holding the long-term winners when they go through painful periods of short-term underperformance. Conviction and confidence are not enough to win the day—courage is also needed, and most needed precisely when it’s hardest to muster.

The posts on this blog are opinions, not advice. Please read our Disclaimers.

The S&P Global REIT QVM Multi-Factor Index Part II – Performance, Country Composition, and Factor Exposure

Contributor Image
Wenli Bill Hao

Director, Factors and Dividends Indices, Product Management and Development

S&P Dow Jones Indices

In the previous blog, we introduced the construction process of the S&P Global REIT Quality, Value & Momentum (QVM) Multi-Factor Index. In this blog, we look into the empirical results of the strategy.

Performance

Rebasing the two indices to 100 on June 30, 1999, the S&P Global REIT QVM Multi-Factor Index reached 999.42 on Aug. 31, 2020, while the S&P Global REIT reached 585.23 (see Exhibit 1).

Exhibit 2 shows the average risk/return profile of the S&P Global REIT QVM Multi-Factor Index against the S&P Global REIT. The S&P Global REIT QVM Multi-Factor Index had a higher annualized average return (12.74%) than the S&P Global REIT (10.11%). On a risk-adjusted basis, the S&P Global REIT QVM Multi-Factor Index was also higher, at 0.67, than the S&P Global REIT, at 0.56.

From both its cumulative performance and average risk/return profile, historically, the QVM strategy has delivered higher returns and risk-adjusted returns than the underlying benchmark (the S&P Global REIT) over a long-term investment horizon.

Country Composition

The S&P Global REIT QVM Multi-Factor Index uses a bottom-up stock selection approach for regional composition. The only constraint is that U.S. companies account for 60% of the weight, while non-U.S. companies account for 40%. As shown in Exhibit 3, the historical country weight composition was in line with the design, with U.S. companies weighted at about 60.7% over the period studied. In comparison with its benchmark, the index underweighted the U.S. (-4.2%), the UK (-5.1%), and Japan (-2.5%), while it overweighted countries such as Australia (+1.5%), Canada (+2.2%), Singapore (+1.9%), and South Africa (+2.7%).

Fundamental Risk Factor Exposure

To better understand the characteristics of the S&P Global REIT QVM Multi-Factor Index, we use a commercially available fundamental risk model to capture selected risk factor exposure differences (see Exhibit 4).

The strategy had the highest positive tilt toward book to price (0.33), followed by dividend yield (0.32), earnings yield (0.15), medium-term momentum (0.15), and profitability (0.08). Results show the strategy constituents tended to have higher value (correlated to the FFO to price ratio factor), higher momentum, and better profitability.

On the other hand, the index was most underweight in regard to size (-0.37), followed by leverage (-0.26), liquidity (-0.17), and earnings and sales growth (-0.16) factors. This means companies in the S&P Global REIT QVM Multi-Factor Index tended to be of a smaller size (due to equal weight), have lower leverage, be less liquid (related to smaller size and equal weight), and have more steady growth than companies in the S&P Global REIT.

These results showed that the strategy characteristics were in line with the index design to invest in companies featured with good quality, attractive valuation, and durable risk-adjusted momentum.

In conclusion, through a QVM multi-factor integration approach, the S&P Global REIT QVM Multi-Factor Index met its design objective and had superior returns and risk-adjusted returns to its benchmark, the S&P Global REIT, over the period studied.

The posts on this blog are opinions, not advice. Please read our Disclaimers.