


Why choose index investing? Yes, the merits of diversification and low cost are usually factored in, though one critical benefit that many do not realize is the transparency that is provided in the methodology of an independent index provider. To understand what goes into the design and methodology of an index, it’s important to note that it’s not a random pick of securities to represent the index’s concept or design. So, let’s skim through some basics of index construction.
Indices offer a wide range of options whereby their calculation methods might vary. Most equity indices are market-cap weighted and float adjusted, where each stock’s weight in the index is proportional to its float-adjusted market value. Some equity indices are price-weighted indices, in which constituent weights are determined solely by the prices of the constituent stocks in the index. An example would be the Dow Jones Industrial Average®. Then there are equal-weighted indices in which each stock is weighted equally in the index. There can be restrictions placed in the index where certain constituents are assigned a minimum or maximum weight, and this can be applied to sectors as well. A few more to add to the variety are options include leveraged and inverse indices, which return positive or negative multiples of their respective underlying indices, dividend indices, which track the total dividend payments of index constituents, and the list goes on.
A common query among many is how exactly is an index calculated? Is it a simple average, or is there some complex formula that runs that magic number? The key concept to understand index calculation would be the index divisor. In a capitalization-weighted index, wherein the portfolio consists of all available shares of the stocks in the index, the total value will be a large number (e.g., the float-adjusted market value for the S&P 500® is a figure in the trillions of U.S. dollars). Hence, to make it easy, the number is scaled down by dividing the portfolio market value by a factor, usually called the divisor.
An index does not behave like a portfolio, as a stock that is added to or deleted from an index would not result in the index level changing, in contrast to a portfolio’s value that would usually change to reflect movements in its holdings. To ensure that the index’s value, or level, does not change when stocks are added or deleted, the divisor is adjusted to offset the change in the market value of the index. Thus, the divisor plays a critical role in the index’s ability to provide a continuous measure of market valuation when faced with changes to the stocks included in the index. In a similar manner, some corporate actions that cause changes in the market value of the stocks in an index should not be reflected in the index level. Adjustments are made to the divisor to eliminate the impact of these corporate actions. There is a large range of different corporate actions, from routine share issuances or buybacks to less-frequent events such as spin-offs or mergers. The index provider details the impact of such corporate actions in their methodology document. The application of changes depends on the type of index and the need for the adjustment with respect to the announced corporate action.
Furthermore, index providers list the rebalancing schedule of the index so that the index is consistent with the methodology.
Index providers do not create the passive products, and hence there is complete independence and a lack of bias to the passive product offered by a product provider. For the product provider as well, they can impress upon the neutrality of the product, as the underlying design is based upon the index provider’s methodology.
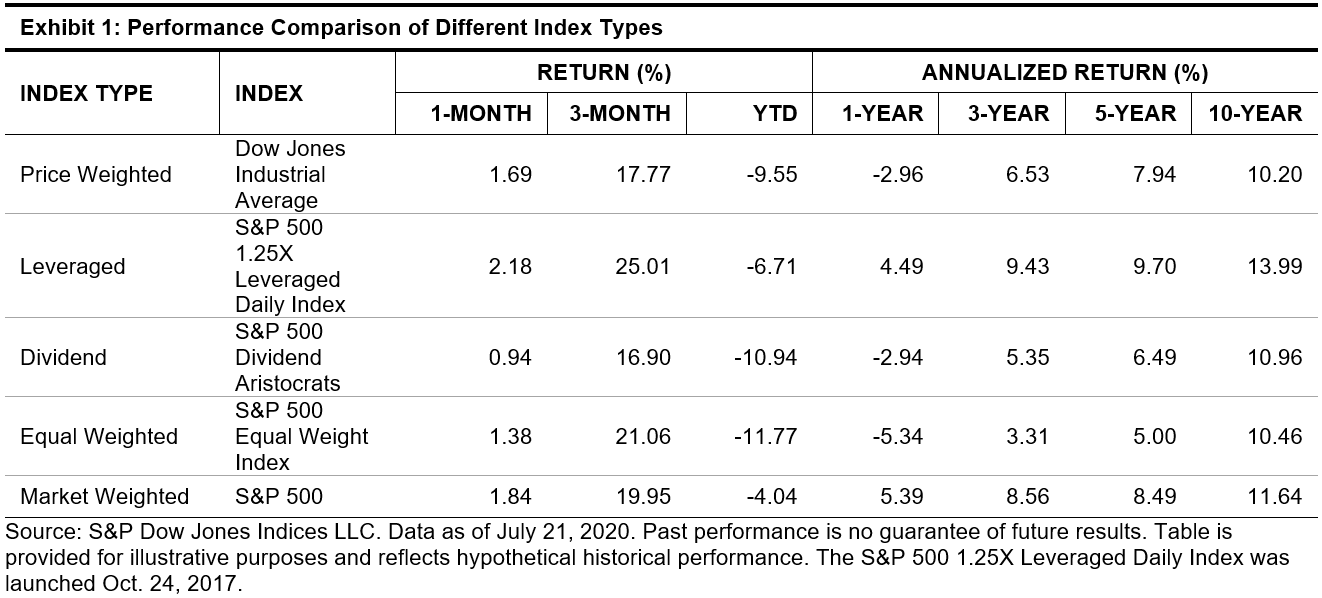
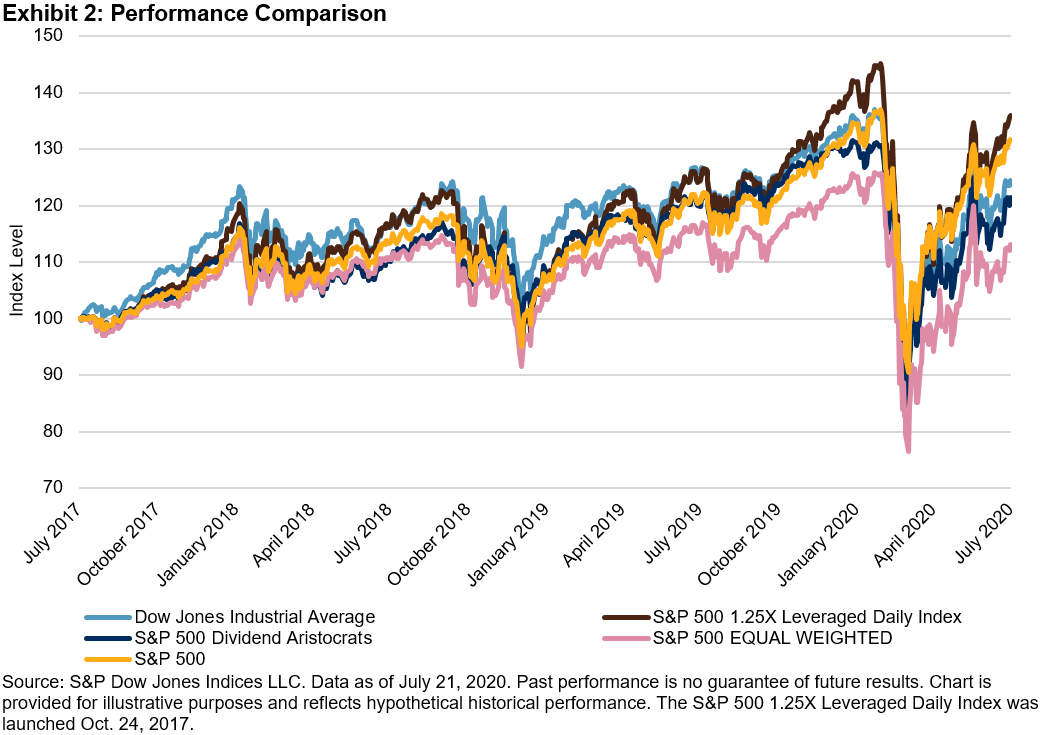
Exhibits 1 and 2 provide a sample of different index types and their trends.


 Source: S&P Dow Jones Indices LLC and FactSet. Data as of January and June 2020. Chart is provided for illustrative purposes.
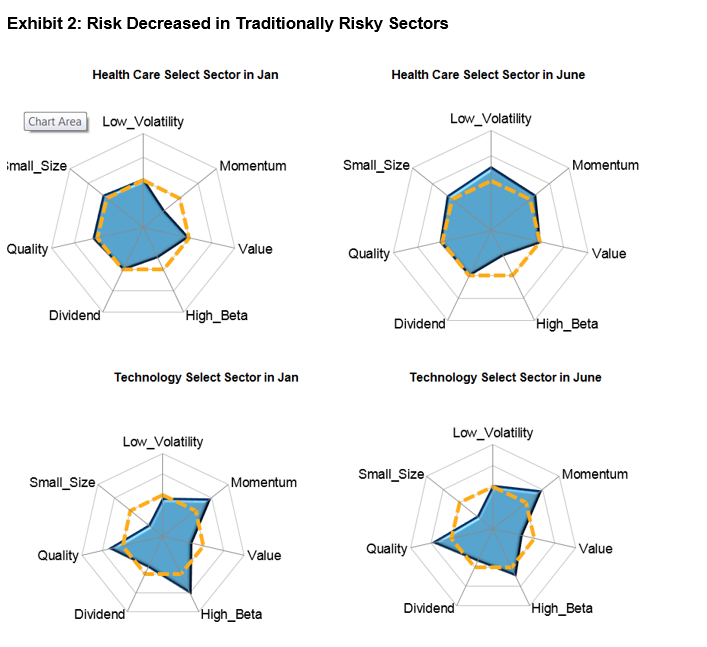 Source: S&P Dow Jones Indices LLC and FactSet. Data as of January and June 2020. Chart is provided for illustrative purposes.