S&P Dow Jones Indices (S&P DJI) and BMV recently launched the long-awaited S&P/BMV Total Mexico ESG Index to great fanfare. The Mexican equities market is in the early stages of exploring ESG-related concepts, from sustainable assessments at the issuers’ level to sustainable investments for asset owners, asset managers, and regulators. The S&P/BMV Total Mexico ESG Index, which uses the world-renowned Corporate Sustainability Assessment (CSA) from SAM (part of S&P Global), is a local index that employs the latest international standards and best practices.
The following statistics aim to highlight the main characteristics of the S&P/BMV Total Mexico ESG Index:
- The index currently includes 29 constituents, but this amount can change during its annual rebalancing. Of these constituents, 23 are also in the S&P/BMV IPC. One of the main differences with the S&P/BMV IPC is that the S&P/BMV Total Mexico ESG Index includes FIBRAS (REITs) in order to recognize these companies from an ESG perspective;
- As of July 20, 2020, the S&P/BMV Total Mexico ESG Index represented 68% of the market cap of the S&P/BMV IPC;
- The weight of the largest constituent was 6.9% as of July 20, 2020, while the largest company in the S&P/BMV IPC was nearly 16% of the index;
- The S&P/BMV Total Mexico ESG Index has an ESG profile that is 17 points higher than its benchmark index, the S&P/BMV Total Mexico Index. This represents a maximum potential increase in its ESG profile of 43% over the benchmark;
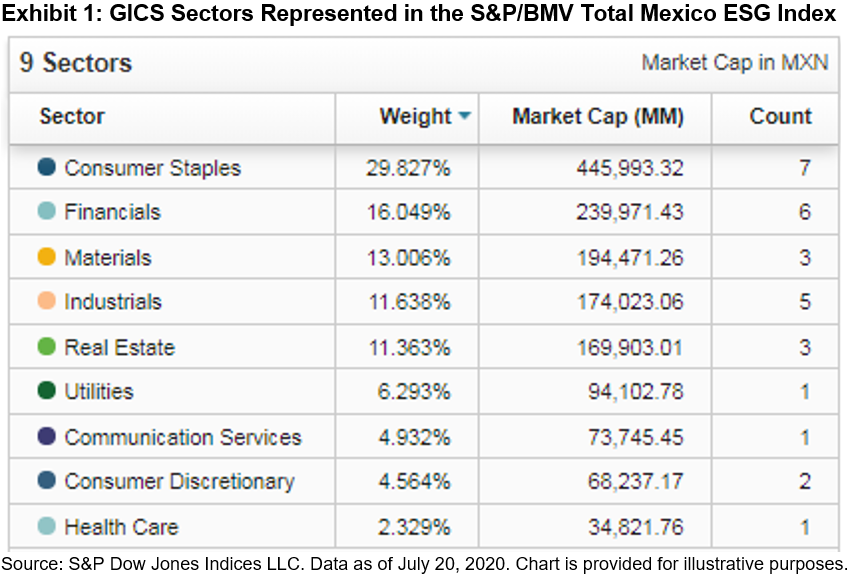
- Looking at sector diversification, we find that nine GICS® sectors are represented in the index (see Exhibit 1).
How many of the constituents in the S&P/BMV Total Mexico ESG Index are included in the other S&P ESG Indices? Let’s see: 15 constituents of the S&P/BMV Total Mexico ESG Index are also constituents of the Dow Jones Sustainability MILA Pacific Alliance Index (55 constituents)—this is noteworthy considering that the methodology of each index is different per the following:
- The Dow Jones Sustainability MILA Pacific Alliance Index is a best-in-class methodology in which the top 30% per industry are selected; while
- The S&P/BMV Total Mexico ESG Index seeks to be aligned with the principal sustainability criteria. The index applies exclusions based on certain business activities and non-compliance with the UN Global Compact criteria. It is weighted by S&P DJI ESG score.
In addition, three companies in the S&P/BMV Total Mexico ESG Index are also members of the Dow Jones Sustainability Emerging Markets Index, which has 97 constituents in total.
Finally, it is important to mention that of the 29 index constituents, 26 completed the SAM CSA, while for the remaining three constituents, SAM performed the evaluation using their public information.
Considering these points, we see the S&P /BMV Total Mexico ESG Index complies with the characteristics of liquidity, representation, replicability, and diversification, which could allow it to be used as benchmark or in financial products such as ETNs.


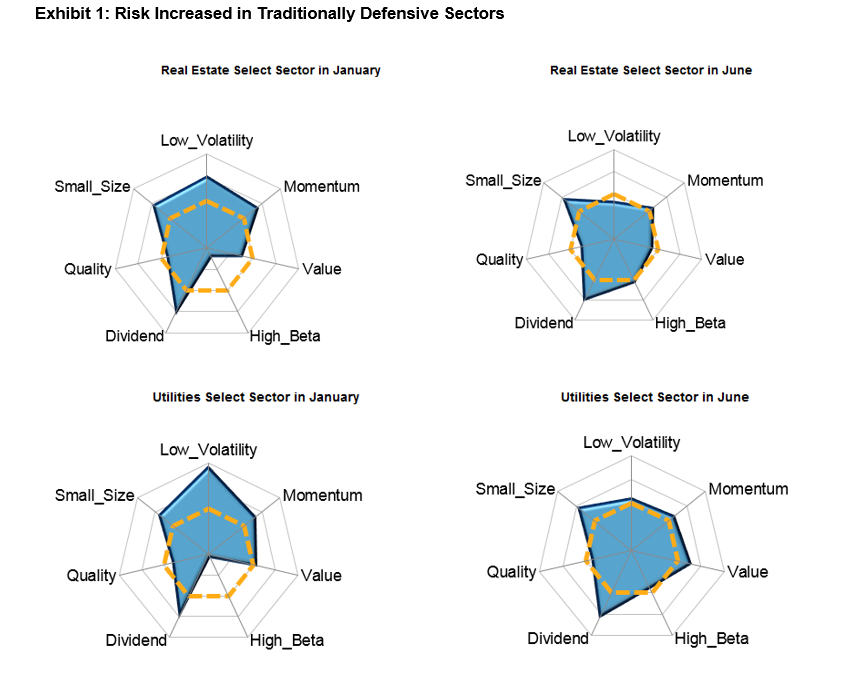 Source: S&P Dow Jones Indices LLC and FactSet. Data as of January and June 2020. Chart is provided for illustrative purposes.
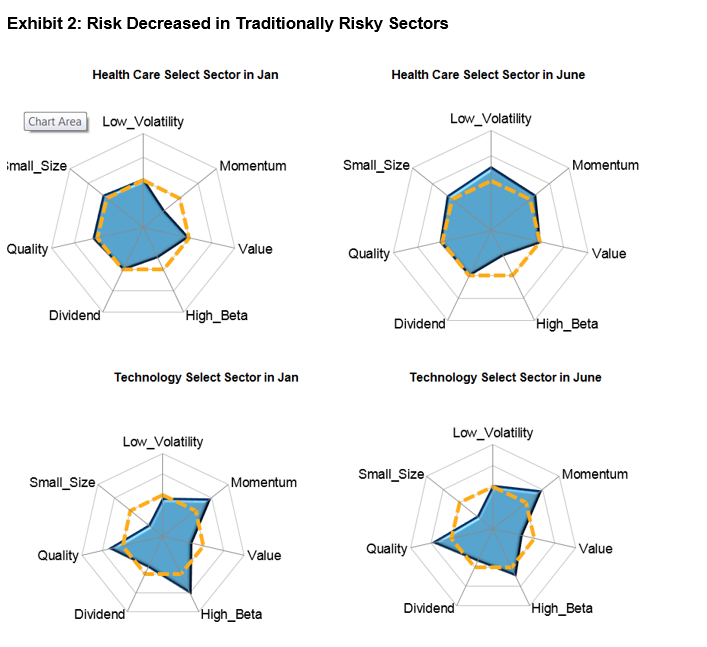 Source: S&P Dow Jones Indices LLC and FactSet. Data as of January and June 2020. Chart is provided for illustrative purposes.