Get Indexology® Blog updates via email.

In This List

Municipal Bonds Are Being Left Behind

Is Passive Investing an Evergreen Option in India?

New Heights for S&P/ASX Linked Volumes

Comparing Bottom-Up versus Top-Down Multi-Factor Construction

Factors and Factor Indices

Municipal Bonds Are Being Left Behind

Contributor Image
Jason Giordano

Director, Fixed Income, Product Management

S&P Dow Jones Indices

Corporate bonds have garnered a lot of attention lately, as the Federal Reserve continues to stabilize markets by establishing multiple facilities that support both the primary and secondary corporate bond markets. As a result, credit spreads have tightened significantly from where they were in March. Since March 23, 2020, the option-adjusted spread on the S&P U.S. Investment Grade Corporate Bond Index tightened more than 150 bps, and yields were within only 50 bps of their all-time lows as of April 30, 2020.

Meanwhile, municipal bonds experienced greater spread widening in March and did not see the extreme tightening that investment-grade corporate bonds did. As of April 30, 2020, the yield of the S&P National AMT-Free Municipal Bond Index was still more than 100 bps above its pre-COVID-19 low.

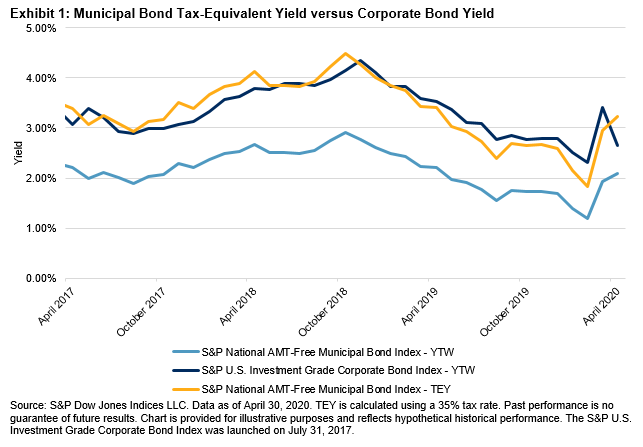
Given the recent rally in the corporate bond market, the tax-equivalent yield (TEY) of the S&P National AMT-Free Municipal Bond Index now exceeds the yield of the S&P U.S. Investment Grade Corporate Bond Index. Less than two months ago, the yield-to-worst of corporate bonds was more than 50 bps higher than the TEY of the S&P National AMT-Free Municipal Bond Index. Exhibit 1 compares the yield of the two indices over the past three years.

Muni Credit Quality Remains High

On April 27, 2020, the Federal Reserve announced it would be expanding its Municipal Lending Facility to provide support to smaller municipalities and local governments, as well as extending the duration of bonds it will cover. Undoubtedly, issuers of state and local debt will have to grapple with potentially large budget gaps as income tax, sales tax, and other revenue sources have been severely affected by the virus fallout.

However, the overall credit quality of the municipal bond market is much better positioned to weather such potential hardships. Exhibit 2 compares the credit quality distribution of the S&P National AMT-Free Municipal Bond Index to that of the S&P U.S. Investment Grade Corporate Bond Index. While 55% of the investment-grade corporate bond market is ‘BBB’-rated, less than 9% of municipal bonds fall into the lowest rung on the investment-grade ladder.

Compared to corporate bonds, market participants can find relatively competitive yields in the municipal market while also benefitting from much higher credit quality. Additionally, as corporations continue to cut or suspend dividends for an unknown length of time, increasing exposure to municipal bonds provides participants with an opportunity to potentially supplement that missing yield.

The posts on this blog are opinions, not advice. Please read our Disclaimers.

Is Passive Investing an Evergreen Option in India?

How can indices help inform and simplify decision making in the current climate? S&P DJI’s Koel Ghosh explores potential roles indexing could play when allocating for desired outcomes during COVID-19 and beyond.

Read more here: https://www.indexologyblog.com/2020/04/14/passive-investing-an-evergreen-option/

The posts on this blog are opinions, not advice. Please read our Disclaimers.

New Heights for S&P/ASX Linked Volumes

Contributor Image
Sherifa Issifu

Senior Analyst, U.S. Equity Indices

S&P Dow Jones Indices

Since its debut in April 2000, the S&P/ASX Index Series has served as the de facto measure of value and performance for the Australian stock market, becoming an integral part of the country’s market infrastructure. 2020 has tested the resilience of that infrastructure; as pandemic fears gripped financial markets, stocks ricocheted, and trading in index-linked instruments spiked. During this period of volatility, the S&P/ASX Index ecosystem provided crucial liquidity to market participants.

In Q1 2020, many market participants used the most liquid, transparent instruments available to manage their exposure to equities. Futures, options, and exchange-traded funds (ETFs) linked to the S&P/ASX Index Series saw record trading volumes, with over AUD 1 trillion in index-linked trading during the first quarter—a 50% increase from the first quarter of 2019. Trading was mostly concentrated in products tracking the S&P/ASX 200, but products tracking other S&P/ASX Indices saw larger relative increases, with trading tripling year-over-year in products associated with the S&P/ASX 300 and the S&P/ASX Dividend Indices.

Exhibit 1 is updated from our recent paper “Marking 20 Years of the S&P/ASX Index Series,” in which we highlighted the potential liquidity benefits of the ecosystem of tradable products surrounding the S&P/ASX Index Series. We measured the economic value, or index equivalent trading (IET), of futures, options, and ETF trading linked to the S&P/ASX Index Series, in order to capture the value of notional exposure to the underlying index.1

One of the benefits of higher volumes is the potential for lower trading costs. Products linked to the S&P/ASX Index Series displayed some of the lowest trading spreads of all Australian-linked and Australian-focused ETFs, with products linked to the S&P/ASX 200 typically displaying the lowest spreads of all.

In March 2020, trading costs soared globally, providing the test of record highs in volatility. Across the whole first quarter, average bid-ask spreads were wider across the board for Australian ETFs.

The average bid-ask spread on Australian-listed ETFs linked to the S&P/ASX 200 was 0.17%, while the average bid-ask spread for all Australian-listed and Australian-focused ETFs was 0.75%. Compared to the equivalent figures for 2019, spreads on ETFs linked to the S&P/ASX 200 rose by only 12 bps, while the average was 39 bps.2  Of the five Australian ETFs with the lowest average bid-offer spreads in Q1 2020, four were linked to the S&P/ASX 200, S&P/ASX 50, or S&P/ASX 300 (see Exhibit 2).

Market efficiency is not the gift of a benevolent providence. A trading ecosystem sufficiently large and active can benefit asset owners and investment managers by offering transparency, efficiency, and improving confidence. And as markets reached lows, the importance of liquidity and benefits of a large and trusted ecosystem reached new heights.

1 See “A Window on Index Liquidity: Volumes Linked to S&P DJI Indices,” (2019), for details of how the IET is calculated for various types of products.

2 See Exhibit 10 of “Marking 20 Years of the S&P/ASX Index Series,” (2020), for details on Average Bid-offer Spreads in 2019.

The posts on this blog are opinions, not advice. Please read our Disclaimers.

Comparing Bottom-Up versus Top-Down Multi-Factor Construction

Contributor Image
Lalit Ponnala

Director, Global Research & Design

S&P Dow Jones Indices

The S&P 500® Quality, Value & Momentum Multi-Factor Index is designed to measure the performance of stocks having the highest combination of quality, value, and momentum (QVM). It takes a “bottom-up” approach of scoring each stock on its individual factor attributes and selecting stocks that jointly score highest across all the factors [1]. In light of the recent market turbulence, let us examine the performance of this index in comparison with the alternative “top-down” approach to multi-factor portfolio construction, i.e., taking an equally weighted combination of single-factor indices, referred to as an “index of indices” (IOI)[2].

During the recent market sell-off, most of the factor indices declined until they reached a bottom in late March, before rebounding partially over the following month. Exhibit 1 shows the performance of single-factor indices and the two multi-factor combinations. While the S&P 500 QVM Multi-Factor Index’s outperformance over the IOI approach was not massive, it still did provide about 60 bps of excess return in both declining and rising phases of the market.

In order to see if there is any compositional bias that leads to this outperformance, we examine the overlap between the S&P 500 QVM Multi-Factor Index constituents and the individual factor index constituents. We quantify this overlap as the percentage of index weights held in common [3].

Exhibit 3 shows that the S&P 500 QVM Multi-Factor Index tends to have a higher overlap with the quality factor (which has outperformed recently [4]), and a lower overlap with the value and momentum indices. This is partly due to a negative correlation between momentum and value exposures among S&P 500 constituents (see Exhibit 4), which implies that high-quality stocks have a better chance of being selected when constituents are sorted on an average of all three factor scores.

Combining factors in a top-down manner tends to dilute individual factor loadings, since stocks that have a strong positive score on one factor might have a large negative score on another [5].

By picking overall winners across all factors, the S&P 500 QVM Multi-Factor Index held up relatively better than the top-down (IOI) approach during the recent market turmoil. Though the examined time period is relatively short and the excess performance is small, the potential benefits of bottom-up selection still shined through.

[1] https://spdji.com/indices/strategy/sp-500-quality-value-momentum-multi-factor-index

[2] “The Merits and Methods of Multi-Factor Investing” available at https://spdji.com/indexology/factors/the-merits-and-methods-of-multi-factor-investing

[3] Factor dashboard for April 2020, available at https://spdji.com/indexology/factors/get-the-latest-us-factor-returns

[4] https://www.indexologyblog.com/2020/04/22/the-sp-500-quality-index-attributes-and-performance-drivers/

[5] https://www.blackrock.com/institutions/en-axj/insights/factor-perspectives/multi-factor-strategies

The posts on this blog are opinions, not advice. Please read our Disclaimers.

Factors and Factor Indices

Contributor Image
Craig Lazzara

Former Managing Director, Index Investment Strategy

S&P Dow Jones Indices

There is a subtle but important distinction between factors and factor indices.  “Factor” denotes an attribute with which long-term excess returns are thought to be associated.  Fama and French, for instance, famously found that small size and cheap valuation were factors in this sense.  A number of other variables – prominently including momentum, low volatility, and quality – have likewise joined the factor pantheon.

Factor indices are designed to provide exposure to one or more of these underlying factors; although quite distinct in their portfolio construction techniques, their commonality stems from the use of factor attributes as a basis for stock selection.  The frequency with which factor indices are rebalanced will influence the degree to which they provide exposure to their target factors.

For example, imagine an index which aims to deliver exposure to the value factor, and so tracks the 50 cheapest stocks in the S&P 500.  Suppose that, over the six months subsequent to its rebalance, most of those stocks become more expensive than the other 450 S&P 500 stocks.  Then our hypothetical value index, which may have perfectly embodied the value factor six months ago, now will embody it less.  The general principle is clear: a factor index best represents its underlying factors at the moment it is rebalanced.  After that, factor drift is not only possible, but likely.

How much drift, and how likely it is, depends on at least two things.  The first of these is the degree to which the factor is observable.  Factors like momentum and low volatility, e.g., depend only on the movement of prices; it’s easy to know whether a stock has high or low momentum.  Factors like quality or growth, on the other hand, are attributes of a company, not a stock price.  They can only be inferred by using accounting or other non-price inputs (which themselves can be observed only at annual or quarterly intervals, and then sometimes with a substantial lag).  To the degree that we anchor our factor definitions in non-price data, we’re likely to observe relatively slower drift.

A second determinant of drift is the degree to which prices change between rebalances.  Here we can base our expectations of drift on the dispersion of stock returns.  Dispersion measures the extent of idiosyncratic price changes within a parent index.  In a period of relatively low dispersion, the prices of most stocks will have changed by a relatively small amount, leading to relatively low potential factor drift.  When dispersion is high, the opposite is true – there will have been a great deal of price movement, and potentially a great deal of factor drift.

Given the spike upward in dispersion that we’ve observed this year, it is likely that turnover for factor indices as they’re rebalanced throughout 2020 will be substantially higher than average.

The posts on this blog are opinions, not advice. Please read our Disclaimers.