Get Indexology® Blog updates via email.

In This List

The S&P 500 Quality Index: Attributes and Performance Drivers

Exploring VIX® in Volatile Markets

How the S&P Managed Risk 2.0 Indices Dynamically Respond to Risk

Low Volatility Response in Brazil

Performance Trickery, part 3

The S&P 500 Quality Index: Attributes and Performance Drivers

Contributor Image
Wenli Bill Hao

Director, Factors and Dividends Indices, Product Management and Development

S&P Dow Jones Indices

COVID-19 driven volatility has caused market participants to refocus on defensive strategies. As investors turned to quality, the S&P 500® Quality Index demonstrated better downside protection and outperformed. Furthermore, it offered a sizable dividend yield of 2.2%. This analysis investigates attributes of the index.

Breaking Down Components

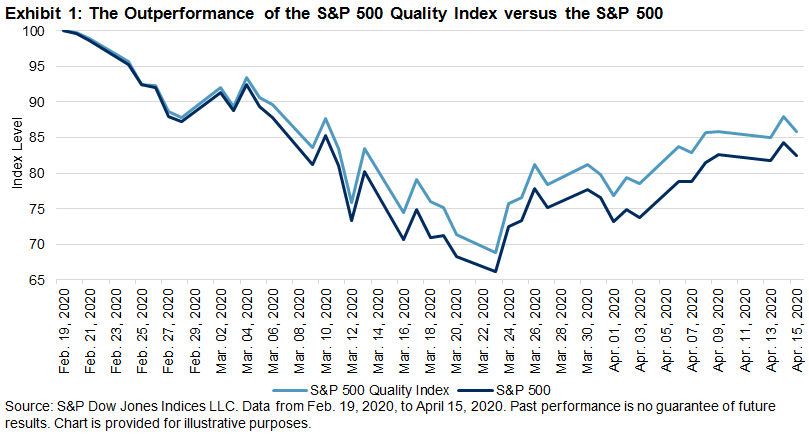
From all-time highs on Feb. 19, 2020, to April 15, 2020, the S&P 500 dropped about 18%. In contrast, the S&P 500 Quality Index outperformed its benchmark by 3.3% (see Exhibit 1).

The S&P Quality Index Series uses three components to define constituents’ overall quality scores:

  • Balance sheet accruals ratio (BSA),
  • Return on equity (ROE); and
  • Financial leverage ratio (leverage).[1]

In Exhibit 2, we dissect the index’s performance into three components: BSA, leverage, and ROE attributions.[2] As seen in Exhibit 2, BSA had the highest contribution to the outperformance, followed by ROE.

ROE and leverage are commonly used metrics. Market participants also generally use earnings quality or growth. The S&P 500 Quality Index uses BSA to capture earnings quality[3] instead of earnings variability (EV),[4] another popular measure to capture earnings growth. Recently, investors have been more focused on earnings quality than growth,[5] resulting in BSA outperforming EV (see Exhibit 3).

Besides its outperformance, the S&P 500 Quality Index also yielded about 2.2%. This level was second only to the S&P 500 Bond Index (see Exhibit 4).

In conclusion, the S&P 500 Quality Index showed its defensive characteristics during this uncertain period. In addition, with a 2.2% dividend yield, it also provided income for investors, especially when 10-year U.S. Treasuries were yielding close to zero.

[1] The detailed factor definition and index construction are laid out in the S&P Quality Indices Methodology.

[2] S&P 500 Quality BSA Attribution: Securities in the eligible universe are selected for index inclusion based on their accruals ratio z-score determined during the semiannual rebalancing of the S&P 500 Quality Index. The values for all securities are ranked in ascending order.

S&P 500 Quality Leverage Attribution: Securities in the eligible universe are selected for index inclusion based on their financial leverage ratio z-score determined during the semiannual rebalancing of the S&P 500 Quality Index. The values for all securities are ranked in ascending order.

S&P 500 Quality ROE Attribution: Securities in the eligible universe are selected for index inclusion based on their return-on-equity z-score determined during the semiannual rebalancing of the S&P 500 Quality Index. The values for all securities are ranked in ascending order.

[3] Richardson, Sloan, Soliman, and Tuna, Accrual Reliability, Earnings Persistence and Stock Prices, Journal of Accounting & Economics, Vol. 39, No. 3, 2005.

[4] EV is usually calculated as the standard deviation of year-over-year earnings per share growth over (n-) number of previous fiscal years.

[5] We selected the top quintile (Q1) of EV factor to form a cap-weighted hypothetical portfolio using the S&P 500 as the underlying universe. The higher the EV, the less stable the earnings growth. For details, please refer to https://www.indexologyblog.com/2018/10/01/measuring-earnings-quality-balance-sheet-accruals-ratio-versus-earnings-variability/.

The posts on this blog are opinions, not advice. Please read our Disclaimers.

Exploring VIX® in Volatile Markets

How can VIX data help us understand the current market environment? S&P DJI’s Tim Edwards explores what recent historical highs for VIX could mean for equity and commodity markets moving forward.

Get the latest Risk & Volatility dashboard on Indexology: https://spdji.com/indexology/risk-management/risk-volatility-dashboard

The posts on this blog are opinions, not advice. Please read our Disclaimers.

How the S&P Managed Risk 2.0 Indices Dynamically Respond to Risk

Explore how a transparent, rules-based approach to risk management is designed to offer participation and downside protection with S&P DJI’s Tianyin Cheng.

To learn more, read Tianyin’s latest blog, “The Trade-Off between Upside Participation and Downside Protection.”

The posts on this blog are opinions, not advice. Please read our Disclaimers.

Low Volatility Response in Brazil

Contributor Image
Maria Sanchez

Director, Sustainability Index Product Management, U.S. Equity Indices

S&P Dow Jones Indices

The S&P/B3 Low Volatility Index Celebrates Five Years of Outperforming Its Benchmark

The COVID-19 pandemic hit the Brazilian equity market hard, causing the worst monthly performance since September 1999.[1] As measured by the S&P Brazil BMI, the Brazilian equity market lost 29.80% in March 2020. The S&P/B3 Low Volatility Index exceeded its benchmark by 640 bps during the same period. Moreover, the low volatility strategy presented superior cumulative and risk-adjusted returns over the 20-, 10-, and 5-year periods (see Exhibit 1).

S&P/B3 Low Volatility Index: Hit Ratio

To highlight the behavior of the S&P/B3 Low Volatility Index in different market circumstances, we analyzed the monthly return data in up and down markets.[2] The results shown in Exhibit 2 are asymmetric, displaying some participation in the up markets and evident downside protection.

The S&P/B3 Low Volatility Index outperformed the benchmark in down markets, providing an average monthly excess return of 2.12%; the strategy exceeded the average by more than 400 bps.

Conclusion

Over the long term, the S&P/B3 Low Volatility Index presented relatively attractive performance in comparison with its benchmark, providing more evidence for the existence of the Low Volatility anomaly, and suggesting that volatility reductions achieved during declining markets do in fact potentiate the benefit of the S&P/B3 Low Volatility Index in terms of risk-adjusted returns.

Happy anniversary, S&P/B3 Low Volatility Index, and keep doing what you do!

[1]   Observed period from September 1999 to March 2020.

[2]   Up and down markets are as measured by the S&P Brazil BMI.

The posts on this blog are opinions, not advice. Please read our Disclaimers.

Performance Trickery, part 3

Contributor Image
Craig Lazzara

Former Managing Director, Index Investment Strategy

S&P Dow Jones Indices

Success is hard to come by for active managers, as readers of our SPIVA reports know well.  Sometimes what appears to be stock selection skill is in fact simply a byproduct of style drift across the capitalization scale.

A majority of large-cap active managers outperformed the S&P 500 only 3 times in 19 years of SPIVA data.  It’s surprising, therefore, to see that 68% of midcap managers outperformed the S&P MidCap 400 Index last year (and 62% of small cap managers outperformed the S&P SmallCap 600).  In fact, a majority of midcap managers outperformed in each of the past three years.  In those same years, an average of 66% of large cap managers underperformed the S&P 500.

Why are the results so good for mid-cap managers?  It’s possible that smaller stocks are less efficiently priced than the largest companies, so that stock selection in the mid- and small-cap universe is easier; the higher dispersion of midcaps and small caps would support that view.  Or perhaps mid- and small-cap managers are simply more skillful than their large-cap counterparts.

These explanations would be more plausible were it not for the long-term record.  For the 10 years ended December 31, 2019, for instance, 84% of mid-cap and 89% of small-cap managers lagged their index benchmarks.  If smaller companies were an easier game with more astute players, the score would be better than this.

We argue instead that style drift – for example, the ability of a midcap manager to buy large cap stocks – can shed light on mid- and small-cap managers’ success.  In 2019, e.g., the S&P 500 rose by 31.5%, well ahead of the 26.2% gain of the S&P MidCap 400.  A mid-cap manager who tilted his portfolio slightly up the capitalization scale might have been rewarded for doing so.  If our conjecture is correct, we’d expect midcap manager performance to improve whenever the S&P 500 outperforms the S&P 400.  Exhibit 1 shows that to be the case.

Exhibit 1.  Style Drift Helps to Drive Midcap Performance

Source: S&P Dow Jones Indices. Data from Dec. 31, 2000 through Dec. 31, 2019. Table is provided for illustrative purposes. Past performance is no guarantee of future results.

A majority of midcap managers outperformed the S&P 400 six times, for an overall success rate of 32%.  When the S&P 500 beat the S&P 400, however, the managers’ success rate rose to 57% (4/7), vs. a success rate of only 17% (2/12) when the S&P 500 lagged.  Alternatively viewed, if the majority of midcap managers outperformed, the 500 usually beat the 400; if the majority underperformed, the 400 was typically in the lead.

Logically, if midcap underperformance creates an opportunity for midcap managers, midcap outperformance might create an opportunity for large cap managers.  Exhibit 2 shows that it does.

Exhibit 2.  Style Drift Helps to Drive Large Cap Performance

Source: S&P Dow Jones Indices. Data from Dec. 31, 2000 through Dec. 31, 2019. Table is provided for illustrative purposes. Past performance is no guarantee of future results.

Midcaps beat large caps in each of the three years when the majority of large cap managers outperformed, suggesting that large-cap managers might have augmented their performance by tilting down the cap scale.  There were no years when the S&P 500 beat the MidCap 400 and the majority of large cap managers outperformed.

Whenever there are significant differences between the performance of capitalization-specific indices, there are opportunities for managers to add value by moving up or down the cap scale.  So far in 2020, of course, the S&P 500 is well ahead of its smaller counterparts; mid- or small-cap managers might well benefit in next year’s SPIVA data.  Such opportunistic moves may be commendable, but they are not evidence of skill at stock selection.

The posts on this blog are opinions, not advice. Please read our Disclaimers.