Get Indexology® Blog updates via email.

In This List

Durability During Distress

Using Sector & Industry Indices to Uncover Opportunity

Pension Fund Industry in Mexico: Analyzing the S&P/BMV Mexico Target Risk Index Series across Different Economic Crises

The Difference a Month Makes: Keeping the Pulse of the Mexican Insurance Market

Two Sides of Volatility

Durability During Distress

Contributor Image
Anu Ganti

U.S. Head of Index Investment Strategy

S&P Dow Jones Indices

Income-seeking investors have always had to compromise between the level of dividend payments and the safety of dividend payments.   The importance of this tradeoff has recently gone viral, as governmental actions in response to COVID-19 have suppressed global economic activity, causing many companies to suspend or reduce their dividend payments.

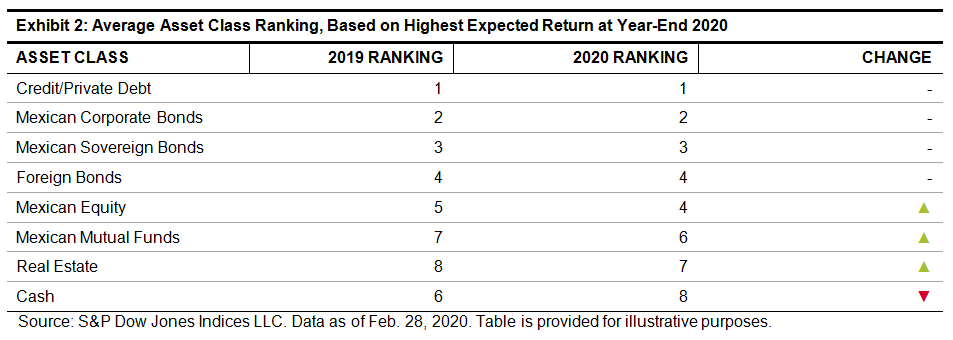
Launched in 2005, the S&P High Yield Dividend Aristocrats Index comprises S&P Composite 1500® members that have increased their dividends annually for at least 20 years.   The market has rewarded consistent dividend payers: Exhibit 1 shows that the High Yield Aristocrats have outperformed the S&P 1500 over the long term.

Source: S&P Dow Jones Indices LLC. Data from December 1999 to March 2020. Index performance based on total return in USD. Past performance is no guarantee of future results. Chart is provided for illustrative purposes.

As of the beginning of 2020, the aggregate capitalization of the High Yield Aristocrats amounted to 18% of the S&P 1500 Composite.  For comparison’s sake, we identified a list of “High Payers”  — the 18% of the 1500 Composite with the highest dividend yields. Exhibit 2 compares the median values of these two portfolios on a number of fundamental metrics that measure the strength of companies making dividend payouts.

The High Yield Dividend Aristocrats appear stronger across the board. For example:

  • Earnings were double last year’s dividend payouts for the Aristocrats, vs. only 1.2x dividends for the high payers. Cash on hand was also a higher multiple of last year’s dividends.
  • The Aristocrats used buybacks to return cash to shareholders to a greater degree than the high payers did. Since buybacks are likely to be reduced before dividends are cut, their usage provides a larger cushion for the Aristocrats.
  • The Aristocrats are larger (median capitalization $12 billion) and more profitable (median ROE 15.5%) than their higher-paying counterparts.
Source: S&P Dow Jones Indices LLC, FactSet and S&P Capital IQ. Market cap data as of April 2020, remaining data as of 2019 calendar year-end. Metrics listed include the median levels. Chart is provided for illustrative purposes.

There obviously can be no guarantees in a pandemic; if a company’s business is affected badly enough, dividend reductions are always possible regardless of how strong the income statement and balance sheet appeared a year ago. What this analysis tells us, though, is that the dividends of companies with consistent dividend growth are better protected from headwinds.

The posts on this blog are opinions, not advice. Please read our Disclaimers.

Using Sector & Industry Indices to Uncover Opportunity

Could higher dispersion in sectors and industries translate to outperformance? S&P DJI’s Anu Ganti explores how index data can be used to inform tactical sector rotation strategies in periods of high volatility.

Get the latest sector dashboard: https://spdji.com/indexology/sectors/us-sector-dashboard.

The posts on this blog are opinions, not advice. Please read our Disclaimers.

Pension Fund Industry in Mexico: Analyzing the S&P/BMV Mexico Target Risk Index Series across Different Economic Crises

Contributor Image
Jaime Merino

Former Director, Asset Owners Channel

S&P Dow Jones Indices

It is unnecessary to give an update on today’s economic situation since most already have a wealth of information over the repercussions of the COVID-19 pandemic. I will instead focus on another major concern: how have pension funds performed, and furthermore, are there similarities in how they have performed during other crises?

After the S&P/BMV IPC dropped 16.38% from its highest monthly return posted in the past 10 years, the S&P/BMV Sovereign MBONOS Bond Index fell 0.72% and the S&P/BMV Sovereign UDIBONOS Bond Index followed with a loss of 3.10%. In this environment, we would expect that pension funds would have their worst month, or even their worst quarter.

Using data provided by Consar (available since December 2015),[1] we can see that Afore assets dropped 3.35%, the second-worst month in the past five years, with October 2018 taking the lead with a loss of 3.89%, as shown in Exhibit 1.

The pension fund system recently changed investment philosophy, moving from a target risk to a target date structure. Since the changes are so recent, we feel it is still appropriate to use the S&P/BMV Mexico Target Risk Index Series as a proxy to analyze performance before and during the COVID-19 crisis since instead of 4 strategies, now 10 different strategies are available with the same rules.

Exhibit 2 illustrates that despite performance losses, the indices had a positive slope and low volatility.

In Exhibit 3, we can see that March 2020 is the fourth-worst month since December 2008 for the S&P/BMV Mexico Target Risk Aggressive Index and S&P/BMV Mexico Target Risk Growth Index, while the S&P/BMV Mexico Target Risk Conservative Index held up well and did not rank among the lowest five months historically, driven by high exposure to fixed income indices and their performance relative to local and foreign equity. February 2009 was the worst-performing month for all the indices, which, interestingly was followed by the top monthly performance for all indices in March 2009, at 6.86%, 5.39%, 4.14%, and 3.53% for the S&P/BMV Mexico Target Risk Aggressive Index, S&P/BMV Mexico Target Risk Growth Index, S&P/BMV Mexico Target Risk Moderate Index, and S&P/BMV Mexico Target Risk Conservative Index, respectively.

Looking at quarterly results, we can see that the first quarter of 2020 was the third-worst quarter for all indices except the S&P/BMV Mexico Target Risk Conservative Index, while Q2 2013 and Q4 2018 suffered greater losses.

Yearly results show that only the S&P/BMV Mexico Target Risk Aggressive Index recorded a loss in 2018 (we consider the 0.01% loss of the S&P/BMV Mexico Target Risk Growth Index flat), and in 2013 all other indices finished in the black.

Without minimizing the current COVID-19 crisis, there is a glimmer of hope. History shows that crisis months with heavy losses can be followed by positive months and, when using a disciplined approach of diversification and risk management, even result in a year ending on a positive note.

While the results of the S&P/BMV Mexico Target Risk Index Series may differ from those of any particular Afore, the indices were created taking into account the investment regime of Consar (read more here) and provide a benchmark we can use with our own Afore. In conclusion, do not be afraid of a month with losses and instead use a disciplined investment approach in line with your risk tolerance.

[1] http://www.consar.gob.mx/gobmx/Aplicativo/WebDashboard/WebDashboard.htm

The posts on this blog are opinions, not advice. Please read our Disclaimers.

The Difference a Month Makes: Keeping the Pulse of the Mexican Insurance Market

Contributor Image
Kelsey Stokes

Director, Multi-Asset Index Sales

S&P Dow Jones Indices

In February 2020, S&P Dow Jones Indices (S&P DJI) and the Association of Mexican Insurance Companies (AMIS) conducted the second annual survey of insurance investment officers in Mexico about the state of the local insurance industry. While this survey was meant to help take the pulse of the Mexican insurance market, what we did not predict was that shortly after the survey concluded, the Mexican economy would feel the combined shocks of COVID-19 and lower global oil prices.

We recently published the results of this survey to highlight the perspectives of the insurance investment officers at a point in time, with the recognition that this survey assumes relatively “normal” market conditions, and importantly, these are now no longer “normal” market conditions. With that in mind, we want to highlight some of the changes that have already taken place during the past month.

Downgrades and Negative Ratings Outlooks

On March 26, 2020, S&P Global Ratings lowered its local and foreign currency ratings on Mexico to ‘BBB+’ from ‘A-’ and to ‘BBB’ from ‘BBB+’, respectively. In line with this downgrade, on March 27, 2020, S&P Global Ratings also lowered its ratings on several Mexican insurance entities whose investment portfolios had a significant portion of sovereign debt (the details of which are outlined in this report).

In our survey, we asked respondents to focus on the asset allocation of their excess capital, where they have a bit more latitude in what they can invest. Between the 2019 and 2020 surveys, companies decreased their allocation to sovereign bonds while they increased their allocation to corporate, private, and foreign debt; still, sovereign bonds comprised the majority of their allocation of excess capital (see Exhibit 1).

At the time of the survey, more than 20% of respondents said they expected to decrease allocations to Mexican sovereign bonds. Given the current market conditions and ratings outlook, it is likely that this percentage would be much higher today.

A Liquid but More Volatile Mexican Peso

As my colleague María Sánchez noted in her recent blog post, the Mexican peso was the Latin American currency most affected in March 2020, with a depreciation rate of 16% relative to the U.S. dollar. Still, the peso remains a highly liquid currency.

The insurers we surveyed had relatively low expectations for cash as an asset class in 2020 even before the market crisis. We asked them to order several asset classes in terms of expected return—irrespective of their allocations or risk tolerances—where “1” corresponded to the highest expected return. Exhibit 2 shows the average ranking of the asset classes based on highest expected return in 2020; respondents expected cash to have the worst performance.

Separately, 17% of respondents said they expected to decrease their allocations to cash. Again, it is likely that this percentage would be higher given today’s market conditions.

Join us for a webinar on May 6 where representatives from S&P DJI and S&P Global Ratings will discuss the impact of COVID-19 and how insurers can get ahead of the headwinds facing the local insurance market. A replay of the webinar will also be available at the same link.*

*The webinar will be in Spanish.

The posts on this blog are opinions, not advice. Please read our Disclaimers.

Two Sides of Volatility

Contributor Image
Craig Lazzara

Former Managing Director, Index Investment Strategy

S&P Dow Jones Indices

I was recently asked whether volatility was particularly challenging for index fund owners or for active investors.  The answer is “yes.”

For index funds, the challenge arises because rising volatility typically accompanies poor returns.  Between 1991 and 2019, e.g., months in which the S&P 500’s volatility was above median averaged modestly negative total returns.  In contrast, when volatility was below median, monthly returns averaged 1.84%.  This is entirely sensible – a stock, after all, should be valued at the discounted value of its future cash flows.  In times of uncertainty, the discount rate rises, and prices fall accordingly.  If investors are less certain of the future, they’re inclined to pay less for it.

Passive investors, accordingly, are likely to find high volatility damaging to the value of their portfolios; other than “this too shall pass,” it’s difficult to find anything to say in mitigation.  For active investors, however, an interesting subtlety arises.

The ability of an active manager to add value depends most importantly on his skill level.  But it also depends on how much opportunity the market presents.  We can measure the level of opportunity by monitoring the market’s dispersion – i.e., the degree to which the returns of the stocks in a given index are close together or widely separated.  Dispersion and volatility tend to move up and down together – other things equal, the more disperse returns are, the more volatile the market as a whole will be.

For much of the past decade, dispersion has been well below its average level.  This is one of the reasons that active managers as a group have had such a difficult time outperforming passive benchmarks.  In March, however, both volatility and dispersion spiked upward.  We observe the same effect not only across global equity markets, but also when we measure dispersion across sectors, countries, and asset classes.

This means that the value added of a skillful (or lucky) active manager can be considerably larger in March 2020 than it would have been a year – or even a month – earlier.  For less skillful (or unlucky) managers, the potential magnitude of underperformance is similarly magnified.  In fact, preliminary data on first quarter performance note a widening gap between the top and bottom performing active managers.

All active managers are likely to see declining portfolio values, but some are likely to outperform the market to an above-average extent.  For active managers (and the asset owners who employ them), volatility is a double-edged sword.

The posts on this blog are opinions, not advice. Please read our Disclaimers.