Get Indexology® Blog updates via email.

In This List

Raising the Bar in Canadian Small Caps

Common Confusion

Unlikely Tariff Rollback Deflated Commodities in November

Stock Pickers: Hope Springs Eternal

Integrating Low-Carbon with Single Factors in Asia

Raising the Bar in Canadian Small Caps

Contributor Image
Michael Orzano

Head of Global Exchanges Product Management

S&P Dow Jones Indices

Prior research has demonstrated that profitability matters for small-cap companies in the U.S. and in global equity markets. For example, the S&P SmallCap 600®—which includes an earnings eligibility criteria—has outperformed the broader Russell 2000 Index (with lower volatility) over its 25-year track record.

Our new S&P/TSX SmallCap Select Index extends this phenomenon to Canadian equities, where we have found that a similar effect exists. Simply put, filtering out the “junk” makes a big difference in Canadian small caps. Exhibit 1 illustrates the total return improvement and volatility reduction of the S&P/TSX SmallCap Select Index versus the broader S&P/TSX SmallCap Index over the past 15 years.

How Does the S&P/TSX SmallCap Select Index work?

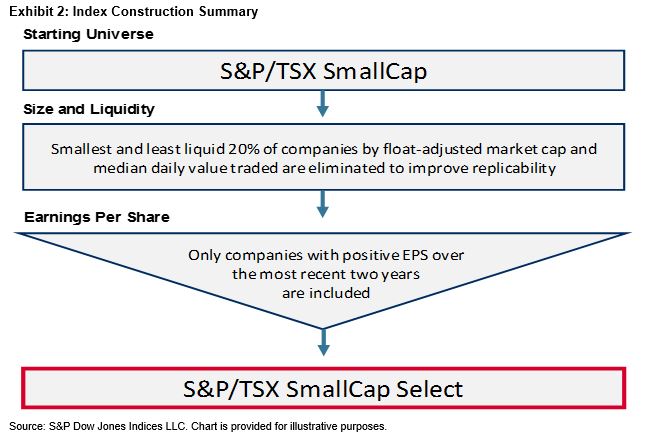
The index follows the same methodology framework as our existing S&P SmallCap Select Index Series, but uses the S&P/TSX SmallCap Index as its selection universe. In order to be eligible for index inclusion, companies must post two consecutive years of positive earnings per share. As a buffer, companies are dropped from the index after posting two consecutive years of negative earnings. In order to improve replicability of the index, we also eliminate the 20% smallest and 20% least liquid companies. The index is weighted by float market cap and is rebalanced semiannually in June and December.

As of the June 2019 index rebalancing, the S&P/TSX SmallCap Select Index included 100 of the 199 companies in the S&P/TSX SmallCap Index and captured about 65% of the float market cap of the benchmark index. As shown in Exhibit 3, the majority of the exclusions were driven by the positive earnings requirement.

To learn more about the impact of including a positive earnings requirement in Canadian small caps, please see our recently published short paper that introduces the S&P/TSX SmallCap Select Index.

The posts on this blog are opinions, not advice. Please read our Disclaimers.

Common Confusion

Contributor Image
Craig Lazzara

Former Managing Director, Index Investment Strategy

S&P Dow Jones Indices

The critics of passive investing are nothing if not creative.  One of their objections to the growth of index funds stems from the putative problem of “common ownership.”  The argument is that index funds’ ownership of many of the competitors in most industries encourages or facilitates collusive behavior.  “[T]he fear is that by owning chunks of many companies in a sector…investors are influencing them to act in ways that maximize gains for all. That is opposed to pushing individual companies to compete more vigorously with rivals and undercut one another on price.”

Many of the fronts in the counterattack against indexing are manned largely by active investment managers; this one, in contrast, seems to be mainly the province of academics, and especially of law professors, some of whom think that index fund ownership of much of corporate America violates anti-trust law.  Probably the most often-cited example of the putative common ownership effect is an academic claim that U.S. airline ticket prices are “10% to 12% higher because of common ownership.”  No one, interestingly enough, claims that index funds explicitly encourage corporate managements to fix prices; rather, index managers supposedly don’t encourage vigorous competition.  “Doing nothing, that is, not pushing portfolio firms to compete aggressively against each other” supposedly produces anti-competitive results because corporate managements know that their shareholders are also owners of their competitors.  “Softer competition” is simply a result of the nature of every corporation’s shareholder registry.

It’s not hard to understand why professors like this argument so much: it’s clever and reflects a basic understanding of industrial structure.  Monopolies are more profitable than competitive markets.  However, making the argument that index funds are the likely driver of monopolistic behavior requires us to believe in two additional propositions:

  1. The sum of the profits of competing firms will be higher if they share a monopoly than if they compete against one another aggressively.
  2. Some shareholders, including (but not limited to) index funds, own shares in more than one competitor, and may therefore be happy with their proportional share in a monopoly.

The problem is that proposition 1 does not depend on proposition 2.  Having a share of a monopoly may be more profitable than competing actively, for both shareholders and firms, even if there is no overlap in ownership.  If there are competitive issues in some industries, index funds can’t be fairly blamed for producing them.

The posts on this blog are opinions, not advice. Please read our Disclaimers.

Unlikely Tariff Rollback Deflated Commodities in November

Contributor Image
Fiona Boal

Managing Director, Global Head of Equities

S&P Dow Jones Indices

The broad commodities were tepid in November. The S&P GSCI was flat for the month and up 9.9% YTD. The Dow Jones Commodity Index (DJCI) was down 2.1% in November and up 4.5% YTD. Gains were driven by the energy complex, while both precious metals and industrial metals detracted from headline performance.

The S&P GSCI Petroleum was up 2.0% in November. Oil prices were poised to end the month near two-month highs on expectations of an extension of OPEC+ production cuts, but on the last trading day of the month prices fell by over 4% due to fresh concerns over U.S.-China trade talks and a record high U.S. crude output of 12.5mm barrels per day. OPEC and Russia are likely to extend existing production cuts by another three months to mid-2020 when they meet in early December. In the physical oil market, traders are paying near-record premiums for sweeter crude barrels, as new marine fuel regulations from the start of 2020 have encouraged refiners to use crude oil grades that produce less high-sulphur fuel oil.

The S&P GSCI Nickel was in freefall in November, down 18.1%, with the largest move by far within the industrial metals space. This was due to the market focusing attention on current subpar demand, even with Indonesia cutting back exports. Prices for stainless steel, of which nickel is a component, have continued to decline due to record inventories. With a technical drop in support of its 200-day moving average and market participants’ bullish positions exited, the environment was ripe for a big move lower. In spite of these conditions, the S&P GSCI Nickel was still up 29.5% YTD and was one of the better-performing commodities overall. The S&P GSCI Lead and the S&P GSCI Zinc fell about 10% and 8% respectively, while the S&P GSCI Iron Ore rose 7.71% after falling 5.9% the prior month.

The S&P GSCI Gold lost some of its luster in November, down 3.1% on the back of an overall better risk sentiment, with equity markets continuing to post new all-time highs and VIX® near multi-month lows. However, gold’s loss was palladium’s gain. The S&P GSCI Palladium continued to add to its impressive YTD performance, reaching another new high on the last day of the month to close November up 3.4% and up 55.55% YTD.

The S&P GSCI Agriculture was down marginally in November. As harvest in the U.S. comes to an end, both the corn and soybean markets have continued to be weighed down by the protracted U.S.-China trade talks and plentiful domestic supplies. Improving weather for planting in Brazil and Argentina also added pressure to the markets. The S&P GSCI Coffee ended the month up 13.4%; Arabica coffee supplies have  tightened from recent record levels, with a global deficit now forecast for the 2019-2020 season, an off-year for top producer Brazil’s biennial crop cycle. Certified stocks on the Intercontinental Exchange (ICE) also fell to their lowest level in nearly 18 months.

It was another mixed bag for the livestock sector in November; the S&P GSCI Lean Hogs was down 11.0%, while the S&P GSCI Live Cattle rose 2.8%. Despite the fact that the U.S. sold more pork this year to international buyers than ever before, the S&P GSCI Lean Hogs was down 22.9% YTD, reflecting a significant increase in pork supply. U.S. pork production is on a record pace for 2019.

The posts on this blog are opinions, not advice. Please read our Disclaimers.

Stock Pickers: Hope Springs Eternal

Contributor Image
Anu Ganti

U.S. Head of Index Investment Strategy

S&P Dow Jones Indices

The Wall Street Journal recently quoted several active managers who claim that “conditions for stock picking are improving”. Their rationale is that declining correlations among stocks in the S&P 500 have made it easier for active managers to select stocks based on fundamental analysis.

We have heard this argument before, most notably in 2014 when, as Exhibit 1 demonstrates, correlations had fallen substantially from their financial crisis peak. But 2014 was also a year of record underperformance by active managers, as our SPIVA scorecards demonstrate. As we have argued previously, this is because dispersion, not correlation is the appropriate metric with which to measure the prospective success of stock pickers.

Correlation is a vital tool in analyzing portfolio diversification, but it is dispersion, or cross-sectional portfolio volatility, that offers a more meaningful way to identify opportunities for active management.  Exhibit 2 offers a simple illustration that demonstrates this point:

Compare stock pairs A and B versus C and D. Both pairs have an average return of 6.85%, but it’s obvious that an active manager who can choose between C and D can add more value than her competitor who chooses between A and B. And yet – the correlation of A and B is negative, while the correlation of C and D is 1.0. Dispersion, not correlation, determines the value added potential of active managers.

The posts on this blog are opinions, not advice. Please read our Disclaimers.

Integrating Low-Carbon with Single Factors in Asia

Contributor Image
Akash Jain

Director, Global Research & Design

S&P BSE Indices

Factor investing in Asia has grown at a rapid pace, with smart beta passive AUM growing at a 42% compound annual growth rate over the past five years, albeit from a relatively lower base.[1] With increasing awareness of climate change and related risks, investors may look to integrate carbon screening into their factor portfolios.

In our research paper, Integrating Low-Carbon and Factor Strategies in Asia, we constructed pure factor portfolios (momentum, value, quality, and low volatility) and studied the impact of carbon screening on these portfolios in seven Asian markets—Australia, China, Hong Kong, India, Japan, South Korea, and Taiwan. The pure factor portfolios were constructed by selecting the top quintile of stocks by factor scores from each market from their respective base universe. The carbon-efficient factor portfolios included the same number of stocks as in their respective pure factor portfolios, but were selected from the carbon-screened universe, from which the 33% of stocks with the highest carbon intensity scores were removed. The pure factor and carbon-efficient portfolios were unconstrained by sectors and were equally weighted. The carbon-efficient screening affected the performance and carbon intensity of each factor portfolio differently (see Exhibit 1).

Overall, the carbon screening resulted in higher carbon intensity reductions to the low volatility and value factors than to the quality and momentum factors across Asian markets. Carbon-efficient screening also improved risk-adjusted returns for the quality, value, and momentum portfolios. In contrast, low volatility factor performance was adversely affected by the carbon-efficient screening.

Additionally, carbon screening resulted in different sector exposures when compared with the pure factor portfolios. For example, compared with the pure quality portfolios, the carbon-screened quality portfolios tended to overweight Financials and Information Technology and underweight Materials and Consumer Staples (except in Australia). On the other hand, compared with the pure value portfolios, the carbon-screened value portfolios tended to overweight Financials and Consumer Discretionary and underweight Materials and Energy. For the momentum and low volatility factors, carbon-efficient factor portfolios tended to overweight Financials and Consumer Discretionary and underweight Materials with respect to pure factor portfolios.

Exhibit 2 shows the active factor exposures (in terms of the number of standard deviations) of the carbon-efficient factor portfolios versus their respective pure factor portfolios in Japan. In most cases, the impact of carbon-efficient screening was modest on the targeted factor exposures. Similar observations were made in other Asian markets. We can conclude from these results that carbon-efficient screening did not result in the loss of targeted active factor exposure.

[1]   Banerjee, Alka, “ETFs and the Factor-Based Investing Landscape,” Forum Views: One World One BBF, Vol. 8, Issue 1, pp. 154-156, April 2019.

The posts on this blog are opinions, not advice. Please read our Disclaimers.