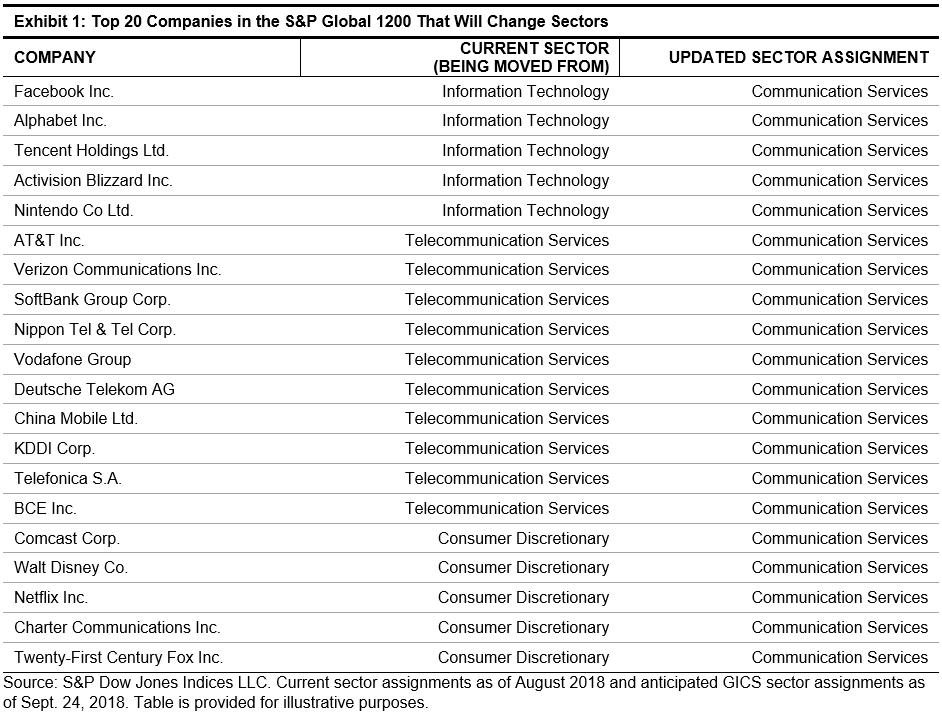
Small caps are outperforming large caps significantly in 2018, mainly from the tax cuts, growth, strong dollar and concern about international trade. This has driven the S&P 600 (TR) 8.4% higher than the S&P 500 (TR) (year-to-date through Aug.31, 2018,) measuring the 5th biggest small cap premium in history since 1995, and is the biggest since 2008, when it reached 10.2%. However, the premium has narrowed to 6.9% in the first two weeks of Sep. and has sparked some debate over whether small caps can continue to outperform.

In at least one recent article, the author’s opinion is to avoid small caps for the rest of the year. The reason is justified mainly since benchmark hugging becomes prevalent in Q4. In order to lock-in gains relative to stated benchmarks for compensation purposes, portfolio managers outperforming their market cap weighted benchmarks through the first three quarters are likely to sell overweights of smaller stocks and trade into larger stocks to match the benchmark. On the flipside, if a manager’s performance is lagging the market cap weighted benchmark, the manager may also move toward benchmark weights to avoid the bottom and prevent getting fired. The article proves its point by using the most widely adopted small cap benchmark, the Russell 2000, to show small caps underperform large caps in Q4.
So, what happens to small caps that comprise an index that is only used as a benchmark by 3% of managers?
As shown in a prior note, and part of a larger paper, the S&P 600 is only used by 25 of 832 managers, representing just 3% of the manager universe and 5% of assets.

eVestment’s systems and other important considerations such as fees that may be applicable. Not for general distribution and limited distribution may only be made pursuant to client’s agreement terms. *All categories not necessarily included, totals may not equal 100%. Copyright 2012-2017 eVestment Alliance, LLC. All rights reserved. Table is provided for illustrative purposes.
This seems to insulate the S&P 600 index from larger benchmark hugging problems evident in historical fourth quarter performance for small caps. Using data since Q1 1995, the earliest available for the S&P 600, it has outperformed the S&P 500 in each quarter on average. The premium is 0.03% in Q1, 1.57% in Q2, 0.12% in Q3, and 0.56% in Q4, making Q4 seem relatively attractive on average for small caps when using the S&P 600. On average, 6 sectors delivered positive premiums in Q4, including utilities, financials, information technology, industrials, health care and real estate, so there may be opportunities in sector rotation strategies, especially into industrials, information technology and real estate that typically have negative premiums in the third quarter.

Another interesting observation is that when the small cap premium is positive in Q4, its premium is nearly double the positive premiums in other quarters. While on average the S&P 600 (TR) outperforms the S&P 500 (TR) by 0.6% in Q4, when the small cap premium was positive in Q4, it was 11.4%, which is much higher than the 4.0%, 6.9% and 6.4% observed during positive quarters, respectively, in Q1, Q2 and Q3. Utilities, health care, industrials, real estate and financials were not only positive on average in Q4 but were also positive in Q4 in more than half the years. Energy was also positive in Q4 more frequently than negative with an exceptionally large premium on average of 14.5%.
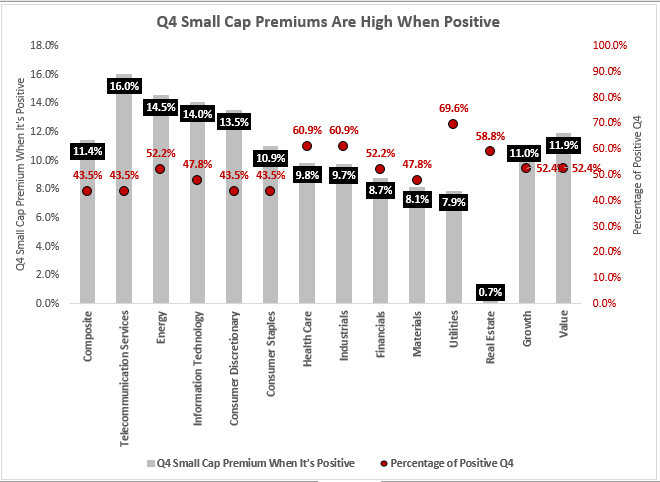
The conclusion is that small cap losses due to benchmark hugging in Q4 shouldn’t necessarily discourage investors from small cap indexing through the year’s end. However, the split between the investable index and benchmark becomes ever more important for performance. In the S&P 600 that is rarely used as a benchmark, performance is driven by the quality and fundamentals per sector such as the usage of utilities across other industries and its domestic focus – especially in small caps with 100% revenue from the U.S., or how small cap energy rises more than large cap energy from rising oil.
For more information about active versus passive performance in small caps, please visit our SPIVA report. Notice 91% of small cap managers fail to beat the S&P 600 over a 5-year time period, a likely reason managers choose not to use it. Also, please see our full report “Big Things Come In Small Packages” for a side by side methodology comparison of the S&P 600 versus the Russell 2000. The quality screen in the S&P 600 is necessary to earn the small cap premium.
The posts on this blog are opinions, not advice. Please read our Disclaimers.