In a prior blog, we showed that the S&P Risk Parity Indices tracked the average performance of active risk parity funds closer than a traditional 60/40 equity/bond portfolio. In this second part of the blog series, we will examine the risk contribution and capital allocation of these indices.
The principles behind risk parity strategies relate to answering a deceptively straightforward question: What is diversification? Traditionally, investors have allocated their capital across multiple asset classes to achieve diversification, such as the 60/40 equity/bond blend. A previous blog by Phillip Brzenk showed that such an approach led to a disproportionate allocation of risk across asset classes, with equities occupying almost all of the portfolio risk. A risk parity strategy, on the other hand, aims for balanced risk contribution from all asset classes. A proper risk parity benchmark should demonstrate roughly equal risk contribution from all asset classes.
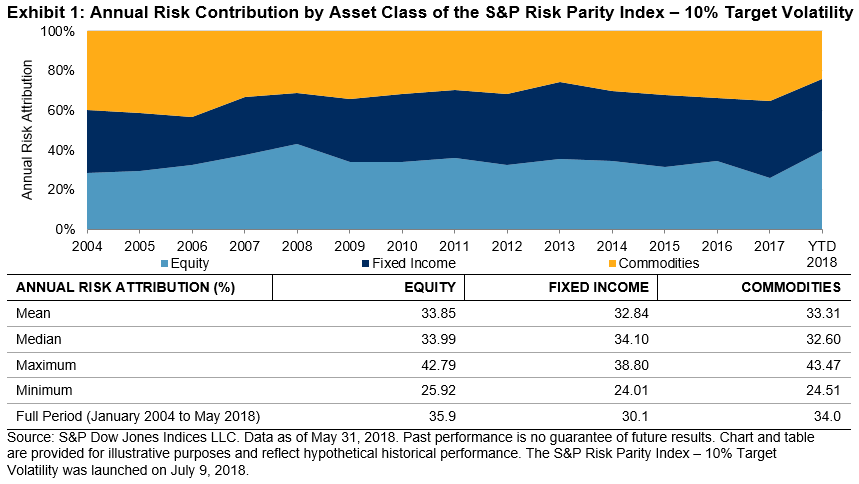
Exhibit 1 shows the back-tested historical risk contribution of the S&P Risk Parity Index – 10% Target Volatility. Over the past 14 years, equities, fixed income, and commodities have contributed roughly the same amount of volatility to the portfolio, despite some fluctuations over time. We can see that the risk contribution of the different asset classes varies based on different market environments. This is not surprising, as we use realized volatilities as the risk measure in the index methodology. For example, in 2008, when the equity market was experiencing a bear market, the risk contribution by equities reached an all-time high of 42.79%. After the volatility seen in 2008 was included in the realized volatility calculation, equity risk contribution subsided to 33.99% in 2009, close to the one-third risk attribution expected in a risk parity portfolio. Despite fluctuations in annual risk attributions, the three asset classes contributed almost equally to the portfolio volatilities over time, either measured as mean or median (see Exhibit 1).
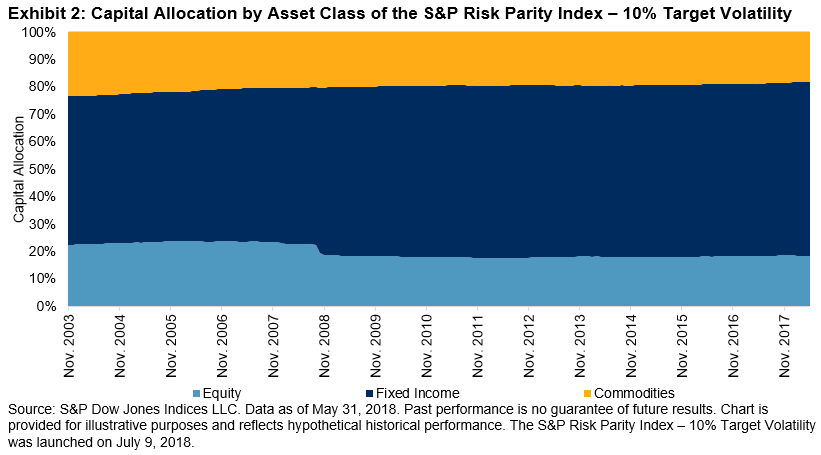
As seen in Exhibit 2, the historical capital allocation verifies that equal risk allocation did not lead to equal capital allocation. Fixed income, the least volatile asset class among the three, has the largest capital allocation to ensure its equal risk contribution to the portfolio. During the 14-year back-tested period, about 60% of the capital was allocated to fixed income securities (mean = 60.0%, median = 62.3%). The remaining 40% of the capital was split between equities (mean = 19.8%, median = 18.2%) and commodities (mean = 20.2%, median = 19.7%) almost evenly. The allocations among the three asset classes were fairly stable over time.