Get Indexology® Blog updates via email.

In This List

Commodities Mixed in May Might Pay

Evaluating Value and Momentum Strategies in Latin American Markets

China’s Bank Stress Test and its Exposure to Environmental Risk

Sector Diversification through Index Linked Products

OPEC's Cuts Are Shrinking Trading Opportunities

Commodities Mixed in May Might Pay

Contributor Image
Jodie Gunzberg

Former Managing Director, Head of U.S. Equities

S&P Dow Jones Indices

No single sector dominated commodity performance in May, which means the supply-side is currently more potent than macro factors like global aggregate demand, the dollar, interest rates or inflation.  Each commodity is being driven by something in its own supply/demand model, mostly unrelated to one another.  That is not just lowering the intra-commodity correlation that can create buying opportunities but has lowered the correlation between stocks and commodities, bringing to light the important role commodities can play in diversification.

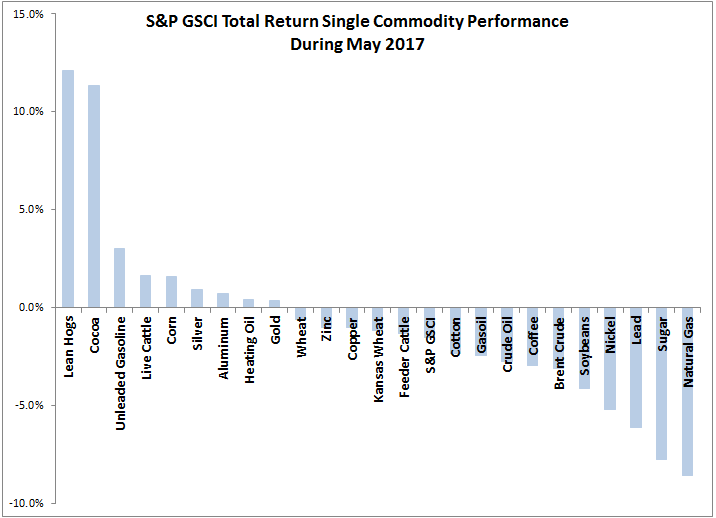
In May, the Dow Jones Commodity Index Total Return fell 1.7% bringing its year-to-date performance to -5.3%, and the S&P GSCI Total Return fell 1.5%, pushing down its year-to-date performance to -8.5%.  While livestock (+4.4%) and precious metals (+0.4%) were the only positive sectors in the S&P GSCI, 9 of the 24 commodities were positive, and were from all the sectors.  Lean hogs (+12.1%,) cocoa (+11.3%) and unleaded gasoline (+3.0%) were the biggest winners while natural gas (+8.6%,) sugar (+7.7%) and lead (+6.2%) were the biggest losers.

Source: S&P Dow Jones Indices

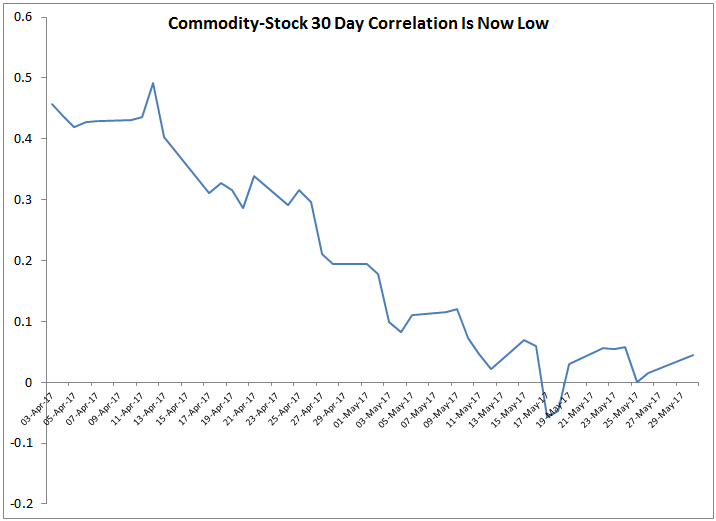
This disparity is important since the supply-shocks supporting it comprise the factor (expectational variance) that drives low correlation in between commodities and also between commodities and other asset classes. Notice the stock-commodity (S&P 500 vs S&P GSCI) correlation has fallen from 0.5 to 0.04 this month, making commodities strong diversifiers again.

Source: S&P Dow Jones Indices

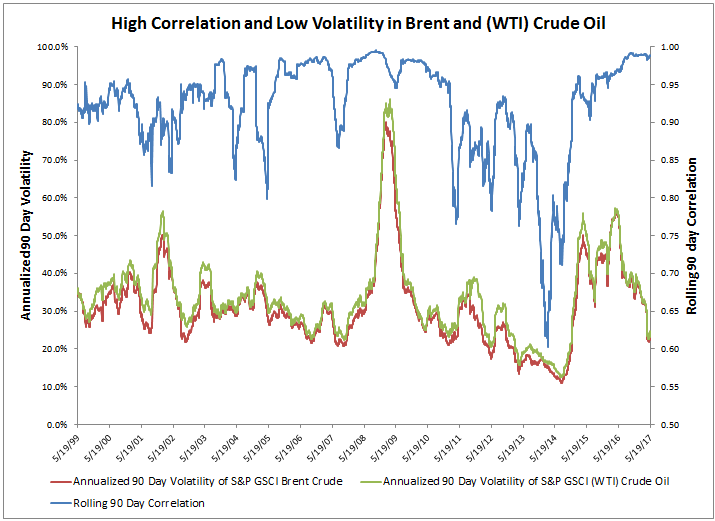
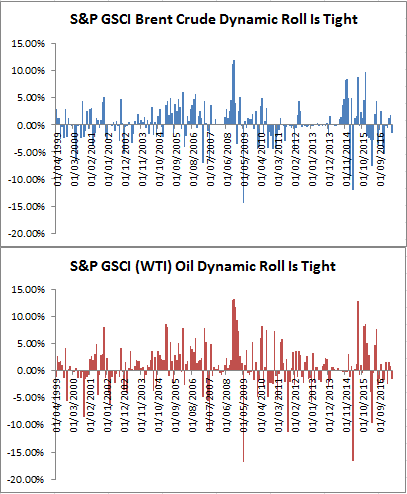
Not only is the diversification an important result but the supply issues matter to the inventory re-balancing process   In May, there were a record 9 new commodities with a positive roll return, reflecting backwardation from shortages.  There have never been this many commodities swinging simultaneously from negative to positive term structures, so that might be a bullish sign ahead of the summer.  However, the term structure hasn’t turned positive yet for unleaded gasoline despite its rise in May even in the face of falling oil.  Typically if Brent crude falls, unleaded gasoline falls slightly more with a down market capture ratio of 107, but when Brent crude rises unleaded gasoline typically increases with an up market capture 109.  If commodities of not just the same sector but the same component are decoupling, and Brent crude is not dragging down unleaded gasoline, not only is that bullish, but it makes a  more compelling diversification argument.

The posts on this blog are opinions, not advice. Please read our Disclaimers.

Evaluating Value and Momentum Strategies in Latin American Markets

Contributor Image
Qing Li

Director, Global Research & Design

S&P Dow Jones Indices

Factor investing has continued to gain momentum in recent years, but the strategy has been predominantly adopted in the developed markets, and research on factor-based strategies in emerging markets remains scarce.  Emerging markets (as measured by the S&P Emerging BMI) returned -13.52% in 2015 but recouped most of the losses in 2016 with a return of 11.3%, and they advanced 13.62% in the first four months of 2017. With the rebound, market participants may find that there are ample opportunities offering value in emerging markets.  As such, a value-based strategy combined with momentum could help identify cheaply priced securities that are on the upswing.

We explored how a factor-based strategy would perform in Latin America by constructing a hypothetical value and momentum portfolio (“Latin America Value Momentum Strategy”).  It should be noted that combining value and momentum is the most commonly employed multi-factor strategy due to the negative correlation demonstrated between the two factors.  The historical correlation between value and momentum factors in Latin American is -0.44 over the past decade.

Adopting the metrics behind the S&P Enhanced Value and Momentum indices, we used three fundamentals—book value-to-price, earnings-to-price, and sales-to-price—to proxy the return to value factor, and a stock’s 12-month price change adjusted by its volatility is used to capture the price momentum.  The weight of a security in the portfolio is the product of its factor score and its float-adjusted market cap.  The portfolios were rebalanced on a semiannual basis in June and December.

Over the back-tested period, the strategy delivered compelling cumulative returns compared to the broad, market-cap-weighted benchmark.  In nearly 20 years, the multi-factor strategy delivered 798% of cumulative return (see Exhibit 2).  During the same period, the broad market only produced one-half of the gains that the strategy provided, with 342% of total growth.

The multi-factor strategy produced an average monthly return of 1.39%, compared to the 0.99% return of the broad market.  The most noticeable performance differential can be seen over a longer time frame (five years or more).  The strategy demonstrated risk-adjusted returns of 0.13 and 0.52 in the 10- and 15-year periods, respectively.  Both figures are significantly higher than benchmark’s 0.03 and 0.42 risk-adjusted returns over the respective periods.  The result is less effective in short-term, as shown in three-year time horizon, with a -0.27 risk-adjusted return for the strategy versus the benchmark’s -0.18 (see Exhibit 3).

Our analysis of the combined value and momentum strategy in Latin America shows that factor-based investing can work effectively in the region over the long-term investment horizon.  The same strategy may deliver different results in individual Latin American countries due to specific market conditions, which is discussed in our related paper “Value and Momentum Strategies in Latin America” and will be also explored in upcoming blogs.

The posts on this blog are opinions, not advice. Please read our Disclaimers.

China’s Bank Stress Test and its Exposure to Environmental Risk

Contributor Image
Chaoni Huang

Head of Business Development, Asia

Trucost

In just over two years, China has developed a policy framework for green finance that aims to shift capital from “brown” fossil fuel industries to “green” low-carbon technologies. We have also seen impressive growth in Chinese green bond issuance that has taken the world by surprise. On joining-up green finance policy and practice, China is increasingly “the one to watch.”

However, scaling up green finance still faces challenges. According to Dr. Ma Jun, chief economist at the People’s Bank of China and director of China’s Green Finance Committee, the biggest problem is effectively internalizing environmental externalities, reversing underinvestment in green projects and overinvestment in brown projects.[1]

To address this issue, Trucost collaborated with the Industrial and Commercial Bank of China (ICBC) and the Green Finance Committee to assess and quantify the environmental externalities of major sectors in China. We recently published a tool for banks and other market participants to assess the potential internalized costs and environmental risks of their investments, using the aluminum sector as a case study.[2] The research identifies key risk factors, including environmental taxation, abatement costs and water scarcity, and quantifies their future cost internalization pathways.

The results showed that primary aluminum and alumina operations in China were most exposed to high costs driven by environmental risk factors. Environmental taxation was the largest cost, accounting for as much as 20% and 13% of the average price of alumina and aluminum ingot, respectively, in the high-stress scenario. Plant operators might find it more economical to opt for early installation of abatement to reduce long-term costs. As a result, they could benefit from emissions trading by selling permits.

ICBC stress-tested their credit in the aluminum sector against the implementation of an environmental tax in 2018. The bank applied the low-stress scenario, assuming that the tax would be implemented at the lower end of the proposed rate and remain constant across provinces over time. As a result, only a small number of corporate credit ratings would be downgraded.

ICBC also found that high-rated companies in its portfolio would be more resilient to the costs of the environmental tax. The probability of default among these companies is minimal, as they are often leading enterprises with strong performance.

Understanding how environmental externalities could be internalized by stress testing loanbooks and portfolios could help financial institutions better manage risks associated with the environmental impacts of their investments. If done at scale, it could channel much needed capital to greener assets, while limiting the flow to high-impact sectors.

It would also demonstrate a strong and constructive response to the Financial Stability Board’s Task Force on Climate-related Financial Disclosures,[3] whose draft recommendations due to be launched at the G20 conference in July 2017 call on organizations to conduct scenario analyses of the risks and opportunities that they face as a result of climate change.

[1] http://unepinquiry.org/publication/establishing-chinas-green-financial-system/

[2] https://www.trucost.com/publication/internalization-of-environmental-costs-for-investment-stress-testing/

[3] https://www.fsb-tcfd.org/publications/recommendations-report/

The posts on this blog are opinions, not advice. Please read our Disclaimers.

Sector Diversification through Index Linked Products

Contributor Image
Ved Malla

Associate Director, Client Coverage

S&P Dow Jones Indices

The proverb “do not put all your eggs in one basket” is what diversification achieves when it comes to investment.  A portfolio can be diversified by investing in multiple asset classes, such as stocks, bonds, real estate, commodities, etc.  A diversified portfolio helps improve the risk/return profile of the investments.

In capital markets, diversification refers to both the security level and sector level.  Security-level diversification refers to having different securities in a portfolio so that no single security makes up too large a percentage of the portfolio.  Sector-level diversification goes a step further, meaning that the portfolio should be distributed among multiple economic sectors and not be restricted to one or few sectors.  Since different securities and sectors may underperform or outperform during different periods, it is often best to avoid concentration of investment into similar stocks or sectors.  Instead, a portfolio may benefit from a focus on different sectors, with the aim of including the best securities from each sector.  A diversified portfolio is likely to not only minimize risk but also ensure lower volatility in the portfolio.

The S&P BSE SENSEX is a highly diversified index and its 30 constituents provide exposure to 10 major sectors: utilities, telecommunication services, information technology, industrials, healthcare, fast-moving consumer goods (FMCG), finance, energy, consumer discretionary, and basic materials.

It is difficult to track all sectors and securities on an active basis; one option to consider is investing in index linked Exchange Traded Funds (ETFs).  This can result in investments that not only have a diversified portfolio, but also a cost-effective one, as the cost of index linked ETFs tends to be comparatively lower.  Exhibit 1 depicts the sector composition of the S&P BSE SENSEX as of March 31, 2017.

Exhibit 1: S&P BSE SENSEX Sector Composition 

Source: S&P Dow Jones Indices LLC.  Data as of March 31, 2017.  Chart is provided for illustrative purposes.

Source: S&P Dow Jones Indices LLC.  Data from March 31, 2012 to March 31, 2017.  Table is provided for illustrative purposes.

Exhibit 2 shows the weight of each of the 10 sectors in the S&P BSE SENSEX from March 2012 to March 2017.

Exhibit 3: Pictorial Chart of S&P BSE SENSEX Yearly Sector Representation

Source: S&P Dow Jones Indices LLC.  Data from March 31, 2012, to March 31, 2017.  Chart is provided for illustrative purposes.

Exhibit 3 is a pictorial representation of Exhibit 2.  This exhibit shows how the 10 sectors of S&P BSE SENSEX have changed from March 2012 to March 2017.  From Exhibit 2, we can see that the finance and information technology sectors have consistently had higher weights.  From Exhibit 3, we can also see that the weight of the basic materials sector has decreased substantially since 2012.

To summarize, we can state that an equity portfolio may benefit from diversification across securities and sectors.

The posts on this blog are opinions, not advice. Please read our Disclaimers.

OPEC's Cuts Are Shrinking Trading Opportunities

Contributor Image
Jodie Gunzberg

Former Managing Director, Head of U.S. Equities

S&P Dow Jones Indices

The unintended consequences of OPEC’s policy (in summer of 2014) of flooding the market with oil to lower prices and gain market share are starting to show.  It seems they failed to realize increasing the price by cutting back supply wouldn’t work with high U.S. inventories.  The spare capacity of OPEC does not matter for oil price when U.S. inventories are high.

Source: Till, Hilary. Does OPEC Spare Capacity Matter? Modern Trader Magazine. May 16, 2016. Data Sources are Bloomberg and IEA.

Chinese demand in addition to U.S. production (including Trump’s export policy,) is probably more critical to oil price formation so is likely keeping oil range-bound, even if the possible range is wide.  According to index history, oil could reach between $25 – $85 dollars before setting record moves.   As OPEC cuts and if U.S. inventories decline to low levels, oil prices may increase, so China may use their own reserves or shop around rather than purchase oil at a higher price, capping the high end of the price range.  Worst case scenario, China might start exporting their reserves into the open market, as they have with other commodities, pushing prices back down. If the U.S. continues with high production and inventories, China may buy more oil as the prices drop, putting a floor on the price.

One may think in this case a directional view is highly uncertain so going long or short oil is a risky bet.  That might be true, but unfortunately, the typical spread and volatility trades available when oil  is range-bound may be scarce now.  The correlation between Brent and (WTI) Crude is now nearly perfect, well above its average, and volatility is only about 2/3 of its historical average with Brent at 22.4% and WTI at 23.2% versus averages of 31.3% and 33.9%, respectively.

Source: S&P Dow Jones Indices

The term structures are also tight.  Historically on average, Crude’s contango is 3.5 times bigger than Brent’s, but now, their term structures are similar with a difference of just 11 basis points, only 1/4 of the average historical absolute difference.

Source: S&P Dow Jones Indices

Here’s a closeup of the past year in the graph above:

Source: S&P Dow Jones Indices

The result is the curve positions are difficult to monetize.  Historically, the dynamic rolling strategy that picks the optimal contract on the curve (as measured by highest implied roll yield) every month adds about 40 basis points monthly to Brent and almost double that to (WTI) Crude.  Now, the dynamic roll is underperforming and the difference in spread between the Brent and (WTI) Crude optimal contracts are only 10 basis points, as compared to an average near 40 basis points.

Source: S&P Dow Jones Indices

In this period of market rebalancing, it seems opportunities are hard to find but the good news possibly is there seems to be more stability from the lower volatility, higher correlation and tight term structures.  If it is underpinned by the fundamentals of a recovering oil market, there could be more upside than downside.  This combination of possible upside with low volatility may be attractive for the 2x leveraged versions of oil.


The posts on this blog are opinions, not advice. Please read our Disclaimers.