Get Indexology® Blog updates via email.

In This List

The Effects of Regulation on Prescription Drugs

Home Prices Are Rising Faster Than You Think

A Closer Look at SPIVA® India Mid-Year 2015

Energy Stocks and Bonds Say Oil May Have Bottomed

Most-Read Blog Posts Q3 2015

The Effects of Regulation on Prescription Drugs

Contributor Image
Glenn Doody

Vice President, Product Management, Technology Innovation and Specialty Products

S&P Dow Jones Indices

According to a story in Canada’s Globe and Mail, one drug maker is about to take on an entire country to protect its right to price drugs the way they see fit.  Alexion Pharmaceuticals, the maker of the drug Soliris, has announced a lawsuit against Canada’s Patented Medicine Prices Review Board after the board began hearings in June to pressure Connecticut-based manufacturer Alexion Pharmaceuticals to lower the drug’s “excessive” price.  The Globe and Mail reports that, “the drug—dubbed the world’s costliest treatment for two rare, life-threatening blood and genetic disorders—is reportedly priced at between USD 500,000 and USD 700,000 annually per patient.”

According to the article, only two countries in the Organization for Economic Cooperation and Development have open pricing on drugs, the U.S. and Chile.  Canada’s regulation of overpricing of patented drugs dates back to 1987, with the establishment of the Patented Medicines Prices Review Board, a regulatory oversight body that has been granted the right to review and control prices of drugs still under patent, and it is a negotiated feature of the North American Free Trade Agreement established in 1994.  Prior to the free trade agreement, drug companies had much less protection against patent infringement by generic drug manufacturers long before their U.S. patents expired.

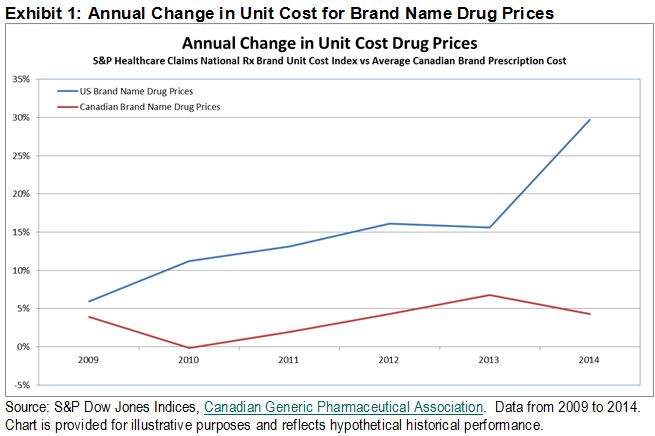
How effective has this board been at controlling overall drug prices in Canada?  By comparing the unit cost of brand drugs sold in Canada since 2009 to those sold in the U.S. (as measured by the S&P Healthcare Claims National Index), we can determine that on average, brand name drug prices have escalated 132% in the U.S. versus 23% in Canada.  Even if we remove 2014, when specialty drugs accounted for an increase of almost 30%, the six-year increase is still 119% in the U.S. versus just 18% in Canada.  Exhibit 1 illustrates the difference in cost increases in unit costs for both countries.

Capture

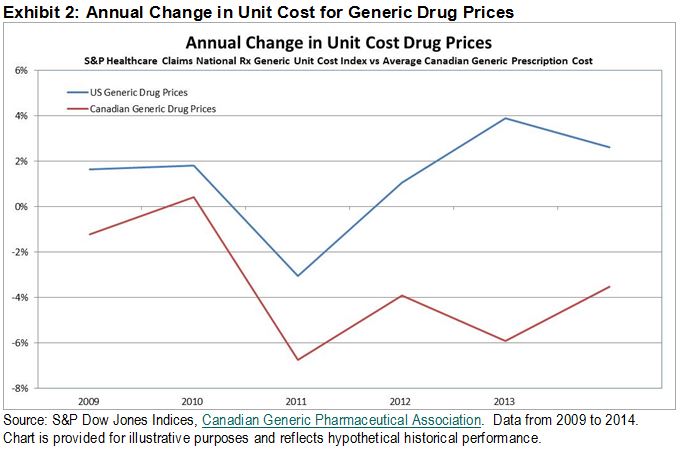
When comparing these cost increases to the average change in generic drug costs over the same period, we can see that open and competitive markets have led to a cost escalation of 8% in the U.S. and a 19% decrease in average costs of in Canada.  Taking these results into account, it becomes apparent just how important this lawsuit is for Canada, however U.S. lawmakers may want to take notice as well.  With a well-documented example from our neighbors to the north, a regulated market may be one potential solution for cost control for brand name drugs in the U.S. market.

Capture

The posts on this blog are opinions, not advice. Please read our Disclaimers.

Home Prices Are Rising Faster Than You Think

Contributor Image
David Blitzer

Former Managing Director and Chairman of the Index Committee

S&P Dow Jones Indices

Prices of existing single family homes, as measured by the S&P/Case-Shiller National Home Price index, are rising is single digit terms.  However, the price changes that matter – the real or inflation adjusted changes – may be higher than many suspect. Backing out inflation, as shown in the chart, gives real increases averaging 6.3% annually in 2012-20015. The compares to real increases of 6.8% annually during 1998-2005, the peak years of the housing boom. With two percent wage increases and one percent inflation, a real increase of 6% or more can make a difference.  These numbers may offer one explanation for the recent popularity of apartments and renting.

The chart shows the rate of inflation (green bars), the real increase in the S&P/Case-Shiller National Home Price Index (red bars) and the nominal increase in the index (blue line). The data for 1976 through 2014 are the 12 months ended in December; for 2015 data for December 2014 to July 2015 are used and annualized.


The Next S&P/Case-Shiller Home Price Release is Tuesday, October 27th


The posts on this blog are opinions, not advice. Please read our Disclaimers.

A Closer Look at SPIVA® India Mid-Year 2015

Contributor Image
Utkarsh Agrawal

Associate Director, Global Research & Design

S&P Dow Jones Indices

The SPIVA India Scorecard reports on the performance of actively managed Indian mutual funds compared with their respective benchmark indices over one-, three-, and five-year investment horizons.  With the SPIVA India Mid-Year 2015 Scorecard, we have also introduced asset-weighted fund returns and the quartile breakpoints of fund performance.

The latest scorecard has revealed that the majority of Indian equity large-cap funds outperformed the S&P BSE 100 over the past one-year period ending June 30, 2015.  In contrast, over the three- and five-year periods, they lagged the benchmark.  The excess returns of this peer group also diminished as the observation period was expanded (see Exhibit 1).

SPIVA EX1. 2015

From the quartile breakpoints of the fund performance, it was observed that there was a wide dispersion over the one-year period, which declined as the observation period was expanded (see Exhibit 2).

SPIVA EX2. 2015

For details on other categories, please read the full report.

For SPIVA® India Mid-Year 2015 Info-graphic, please click here.

The posts on this blog are opinions, not advice. Please read our Disclaimers.

Energy Stocks and Bonds Say Oil May Have Bottomed

Contributor Image
Jodie Gunzberg

Former Managing Director, Head of U.S. Equities

S&P Dow Jones Indices

Last week, the S&P GSCI Crude Oil gained 9.7% in one of its best weeks (24/1501) in history since 1987. It was the second best week in 2015, following its gain of 11.8% in the last week of Aug. Historically, with the exception of the bottom in 1988, there have been greater than 2 weeks of spikes bigger than last week’s before a bottom was hit. So maybe oil hasn’t hit a bottom yet by this metric, but it wouldn’t be completely unprecedented or unreasonable.

Source: S&P Dow Jones Indice
Source: S&P Dow Jones Indices

Although many supporting events happened simultaneously last week like a continued drop in US rig counts, concern about falling production in Canada and Bakken, the decision by the Fed to hold off on the interest rate hike and the Russian attacks on Syria, it’s difficult to make the case the rally is sustainable. Inventories are still very high and demand is questionable. According to the IEA’s Oil Market Report, “a projected marked slowdown in demand growth next year and the anticipated arrival of additional Iranian barrels – should international sanctions be eased – are likely to keep the market oversupplied through 2016.”

Sourec: International Energy Agency - Oil Market Report, Oct. 2015.
Source: International Energy Agency – Oil Market Report, Oct. 2015.

Last, one indicator that has historically crashed at the peak of volatility and oil bottom is open interest. It fell briefly but quickly elevated to its relatively high current level.

Source: S&P Dow Jones Indices and Bloomberg

Despite this, there are calls on oil that call a bottom in this quarter or next, and quote a range of $75 by the end of 2017.  PIRA energy group says the current market slump is setting the stage for prices to surge to $75 within two years, and below is a chart from Morgan Stanley of their oil market outlook, also showing oil in the $75 range for 2017.

Source: http://www.businessinsider.com/morgan-stanley-evolution-of-the-oil-cycle-through-2018-2015-9

So, what is the right call? S&P Dow Jones Indices isn’t in the business of making prediction but the indices are historical storytellers. A new family of indices, the S&P 500 Bond indices, has recently been introduced to help analyze companies and industries inside the S&P 500. Some of the sectors have significantly more equity, like technology, but some have more debt like utilities. Energy is pretty evenly matched, holding similar weights in each the stock and bond composite.

Let’s take a look at the performance relationships between the stocks and the bonds by using the S&P 500 Energy Total Return and the S&P 500 Energy Corporate Bond Index Total Return to see how the market views the equity risk premium, or in other words how strongly the market believes oil stocks will rise (equity performance) or fall (bond performance.) Historically the beta of the S&P GSCI Energy Excess Return (total return – T-bill) to energy stock alpha (S&P 500 Energy – S&P 500) is 1.05 and to energy bond alpha (S&P 500 Energy Corporate Bond Index – T-bill) s is 0.71, with respective correlations of 0.52 and 0.13.

Below is a chart of the historical S&P GSCI Energy TR index levels versus the equity risk premium as measured by the S&P 500 Energy Total Return monthly minus the S&P 500 Energy Corporate Bond Index Total Return monthly. Notice the recent spike in the equity risk premium that has developed in Oct. The magnitude of the equity risk premium and spread change from a discount to a premium is the biggest since Oct. 2011, and the magnitude is the 8th largest on record with the 5th biggest swing.

Source: S&P Dow Jones Indices

Maybe oil is near a bottom, or maybe just that’s the market sentiment. To find out what the experts think visit the replay of the S&P Dow Jones Indices 9th Annual Commodities Seminar. To find out more about the S&P Dow Jones Bond Indices, click here, or click on one of these links if you’d rather watch a short video about the basics of the bond index, or about what is inside the broad bond index or about the bond sectors. Please let us know if you have any questions.


The posts on this blog are opinions, not advice. Please read our Disclaimers.

Most-Read Blog Posts Q3 2015

Contributor Image
Paul Murdock

Manager, Content & Delivery

S&P Dow Jones Indices

In case you missed them, we’ve compiled the most read blogs from the third quarter below.

Timing Gold Is A Fool’s Errand
Has gold reached its bottom?

Inside the S&P 500®…. Bonds!
What is the S&P 500 Bond Index and how does it compare to the iconic S&P 500?

China’s Currency Devaluation and Its Impact on the Indian Stock Markets
How has the devaluation of the Yuan affected the Indian economy and stock markets?

A Game of Thrones Using ETFs
Is there a schism in the ETF industry?

ETFs and Hedge Funds: At What Price Performance?
Why might hedge funds be losing the race for assets?

An Index Provider’s Perspective on the Growing Australian ETF Market
What index-based innovations are shaping the evolution of the Australian ETF market?

The posts on this blog are opinions, not advice. Please read our Disclaimers.