Get Indexology® Blog updates via email.

In This List

Home Prices Are Rising Faster Than You Think

A Closer Look at SPIVA® India Mid-Year 2015

Energy Stocks and Bonds Say Oil May Have Bottomed

Most-Read Blog Posts Q3 2015

Why the S&P 500 Utilities Sector Shined in Q3

Home Prices Are Rising Faster Than You Think

Contributor Image
David Blitzer

Former Managing Director and Chairman of the Index Committee

S&P Dow Jones Indices

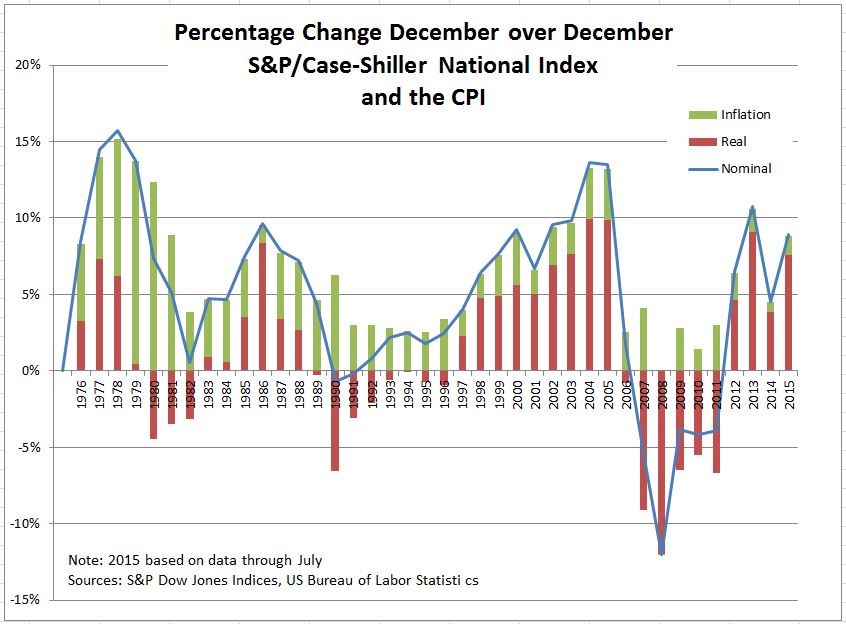
Prices of existing single family homes, as measured by the S&P/Case-Shiller National Home Price index, are rising is single digit terms.  However, the price changes that matter – the real or inflation adjusted changes – may be higher than many suspect. Backing out inflation, as shown in the chart, gives real increases averaging 6.3% annually in 2012-20015. The compares to real increases of 6.8% annually during 1998-2005, the peak years of the housing boom. With two percent wage increases and one percent inflation, a real increase of 6% or more can make a difference.  These numbers may offer one explanation for the recent popularity of apartments and renting.

The chart shows the rate of inflation (green bars), the real increase in the S&P/Case-Shiller National Home Price Index (red bars) and the nominal increase in the index (blue line). The data for 1976 through 2014 are the 12 months ended in December; for 2015 data for December 2014 to July 2015 are used and annualized.


The Next S&P/Case-Shiller Home Price Release is Tuesday, October 27th


The posts on this blog are opinions, not advice. Please read our Disclaimers.

A Closer Look at SPIVA® India Mid-Year 2015

Contributor Image
Utkarsh Agrawal

Associate Director, Global Research & Design

S&P Dow Jones Indices

The SPIVA India Scorecard reports on the performance of actively managed Indian mutual funds compared with their respective benchmark indices over one-, three-, and five-year investment horizons.  With the SPIVA India Mid-Year 2015 Scorecard, we have also introduced asset-weighted fund returns and the quartile breakpoints of fund performance.

The latest scorecard has revealed that the majority of Indian equity large-cap funds outperformed the S&P BSE 100 over the past one-year period ending June 30, 2015.  In contrast, over the three- and five-year periods, they lagged the benchmark.  The excess returns of this peer group also diminished as the observation period was expanded (see Exhibit 1).

SPIVA EX1. 2015

From the quartile breakpoints of the fund performance, it was observed that there was a wide dispersion over the one-year period, which declined as the observation period was expanded (see Exhibit 2).

SPIVA EX2. 2015

For details on other categories, please read the full report.

For SPIVA® India Mid-Year 2015 Info-graphic, please click here.

The posts on this blog are opinions, not advice. Please read our Disclaimers.

Energy Stocks and Bonds Say Oil May Have Bottomed

Contributor Image
Jodie Gunzberg

Former Managing Director, Head of U.S. Equities

S&P Dow Jones Indices

Last week, the S&P GSCI Crude Oil gained 9.7% in one of its best weeks (24/1501) in history since 1987. It was the second best week in 2015, following its gain of 11.8% in the last week of Aug. Historically, with the exception of the bottom in 1988, there have been greater than 2 weeks of spikes bigger than last week’s before a bottom was hit. So maybe oil hasn’t hit a bottom yet by this metric, but it wouldn’t be completely unprecedented or unreasonable.

Source: S&P Dow Jones Indice
Source: S&P Dow Jones Indices

Although many supporting events happened simultaneously last week like a continued drop in US rig counts, concern about falling production in Canada and Bakken, the decision by the Fed to hold off on the interest rate hike and the Russian attacks on Syria, it’s difficult to make the case the rally is sustainable. Inventories are still very high and demand is questionable. According to the IEA’s Oil Market Report, “a projected marked slowdown in demand growth next year and the anticipated arrival of additional Iranian barrels – should international sanctions be eased – are likely to keep the market oversupplied through 2016.”

Sourec: International Energy Agency - Oil Market Report, Oct. 2015.
Source: International Energy Agency – Oil Market Report, Oct. 2015.

Last, one indicator that has historically crashed at the peak of volatility and oil bottom is open interest. It fell briefly but quickly elevated to its relatively high current level.

Source: S&P Dow Jones Indices and Bloomberg

Despite this, there are calls on oil that call a bottom in this quarter or next, and quote a range of $75 by the end of 2017.  PIRA energy group says the current market slump is setting the stage for prices to surge to $75 within two years, and below is a chart from Morgan Stanley of their oil market outlook, also showing oil in the $75 range for 2017.

Source: http://www.businessinsider.com/morgan-stanley-evolution-of-the-oil-cycle-through-2018-2015-9

So, what is the right call? S&P Dow Jones Indices isn’t in the business of making prediction but the indices are historical storytellers. A new family of indices, the S&P 500 Bond indices, has recently been introduced to help analyze companies and industries inside the S&P 500. Some of the sectors have significantly more equity, like technology, but some have more debt like utilities. Energy is pretty evenly matched, holding similar weights in each the stock and bond composite.

Let’s take a look at the performance relationships between the stocks and the bonds by using the S&P 500 Energy Total Return and the S&P 500 Energy Corporate Bond Index Total Return to see how the market views the equity risk premium, or in other words how strongly the market believes oil stocks will rise (equity performance) or fall (bond performance.) Historically the beta of the S&P GSCI Energy Excess Return (total return – T-bill) to energy stock alpha (S&P 500 Energy – S&P 500) is 1.05 and to energy bond alpha (S&P 500 Energy Corporate Bond Index – T-bill) s is 0.71, with respective correlations of 0.52 and 0.13.

Below is a chart of the historical S&P GSCI Energy TR index levels versus the equity risk premium as measured by the S&P 500 Energy Total Return monthly minus the S&P 500 Energy Corporate Bond Index Total Return monthly. Notice the recent spike in the equity risk premium that has developed in Oct. The magnitude of the equity risk premium and spread change from a discount to a premium is the biggest since Oct. 2011, and the magnitude is the 8th largest on record with the 5th biggest swing.

Source: S&P Dow Jones Indices

Maybe oil is near a bottom, or maybe just that’s the market sentiment. To find out what the experts think visit the replay of the S&P Dow Jones Indices 9th Annual Commodities Seminar. To find out more about the S&P Dow Jones Bond Indices, click here, or click on one of these links if you’d rather watch a short video about the basics of the bond index, or about what is inside the broad bond index or about the bond sectors. Please let us know if you have any questions.


The posts on this blog are opinions, not advice. Please read our Disclaimers.

Most-Read Blog Posts Q3 2015

Contributor Image
Paul Murdock

Manager, Content & Delivery

S&P Dow Jones Indices

In case you missed them, we’ve compiled the most read blogs from the third quarter below.

Timing Gold Is A Fool’s Errand
Has gold reached its bottom?

Inside the S&P 500®…. Bonds!
What is the S&P 500 Bond Index and how does it compare to the iconic S&P 500?

China’s Currency Devaluation and Its Impact on the Indian Stock Markets
How has the devaluation of the Yuan affected the Indian economy and stock markets?

A Game of Thrones Using ETFs
Is there a schism in the ETF industry?

ETFs and Hedge Funds: At What Price Performance?
Why might hedge funds be losing the race for assets?

An Index Provider’s Perspective on the Growing Australian ETF Market
What index-based innovations are shaping the evolution of the Australian ETF market?

The posts on this blog are opinions, not advice. Please read our Disclaimers.

Why the S&P 500 Utilities Sector Shined in Q3

Contributor Image
Todd Rosenbluth

Director of ETF and Mutual Fund Research

S&P Capital IQ Equity Research

While the S&P 500 Utilities index has been one of the weakest in the S&P 500 index in 2015, in the third quarter it was a bright spot. As global economic concerns increased, we think investors found the domestic focused, stable dividend, and earnings provided by the sector appealing. While the Federal Reserve’s possible increase in the Fed funds rate could have an adverse effect, the 10-year Treasury yield has fallen back to approximately 2.0%. The average dividend for the S&P 500 utilities sector constituent was 3.9%.

The utilities index was down 8.6% year to date through September, worse than the 6.7% for the S&P 500 index. However, in the third quarter, the sector’s 4.4% increase was a stark contrast to the 6.9% decline for the broader market.

From a profit perspective, according to Capital IQ consensus estimates, the utilities sector is expected to post earnings growth of 0.9% for the third quarter of 2015 and 1.7% for all of 2015, both ahead of the S&P 500 index that is weighed down by energy and more multinational sectors such as consumer staples. The utilities sector is projected to increase EPS/earnings 7.0% in 2016, below the 10% for the S&P 500.

The utilities sector is known for maintaining relatively high payout ratios compared with the broader market. Since earnings growth may be constrained compared with sectors that introduce new products, such as health care or information technology, utilities tend to offer investors a higher dividend due to their relatively steady cash flows, and as an incentive to buy utilities shares.

According to S&P Capital IQ Equity Analyst Christopher Muir, payout ratios for the utilities sector have been higher than the S&P 1500. The five-year average payout ratio of 69.0% for the sector is more than double that of the S&P 1500.

Muir foresees continued high levels of capital spending by the industry, both on regulated and unregulated investments. Regulated capital spending includes spending on infrastructure replacement, new transmission and distribution facilities and lines, and regulated power plants, including new nuclear units currently under construction.

Unregulated spending will mostly focus on new natural gas-fired combined-cycle power plants, and investment in solar and wind generation is also likely.

While investors pulled money out of utilities sector ETFs in the first half of 2015, the sector had the second most inflows during the third quarter, behind energy. There are eight U.S. utility sector ETFs, though their exposures are distinct.

—————————————————————————————————–

S&P Capital IQ operates independently from S&P Dow Jones Indices.
The views and opinions of any contributor not an employee of S&P Dow Jones Indices are his/her own and do not necessarily represent the views or opinions of S&P Dow Jones Indices or any of its affiliates.  Information from third party contributors is presented as provided and has not been edited.  S&P Dow Jones Indices LLC and its affiliates make no representations or warranties of any kind, express or implied, regarding the completeness, accuracy, reliability, suitability or availability of such information, including any products and services described herein, for any purpose.


The posts on this blog are opinions, not advice. Please read our Disclaimers.