Most bond markets ended on a positive note in 2014. Some of the outperformers are the S&P Eurozone Developed Sovereign Bond Index (up 11.98%), the S&P U.S. Issued Investment Grade Corporate Bond Index (up 7.71%) and the S&P China Government Bond Index (up 10.35%). Yet the global yields remained low, i.e. the yield-to-worst of the S&P Eurozone Developed Sovereign Bond Index tightened by 92bps to 0.98%. Please see Exhibit 1 for the selective total return and yield comparisons.
Exhibit 1: Total Return and Yield-To-Worst Comparisons

With the global uncertainties in economic growth, inflation and monetary policy remain; portfolio diversification seems to be the key in 2015, which allows upside participation while minimizes the downside risk of over-concentration.
Looking into 8-year historical data, despite the differences in their economies and monetary policies, the S&P/BGCantor U.S. Treasury Bond Index has a correlation of 0.47 with the S&P Eurozone Developed Sovereign Bond Index.
On the other hand, the U.S. and European bond markets exhibited low correlations with the Pan Asia and Chinese local currency bond markets over the same period.
| S&P/BGCantor U.S. Treasury Bond Index | S&P Eurozone Developed Sovereign Bond Index | |
| S&P Pan Asia Government Bond Index | 0.179 | 0.173 |
| S&P China Government Bond Index | 0.169 | 0.140 |
Specifically, the S&P China Corporate Bond Index had a negative correlation with the U.S. issued high yield and investment grade bonds.
| S&P U.S. Issued High Yield Corporate Bond Index | S&P U.S. Issued Investment Grade Corporate Bond Index | |
| S&P China Corporate Bond Index | -0.224 | -0.104 |
Hence, Pan Asian bonds offer portfolio diversification through the exposure to local rates, credits and currencies. For more information on the performance of the S&P Pan Asia Bond Index family, please visit here.
*Correlation data are as of December 31, 2014, computed from the monthly returns since December 29, 2006.
The posts on this blog are opinions, not advice. Please read our Disclaimers.

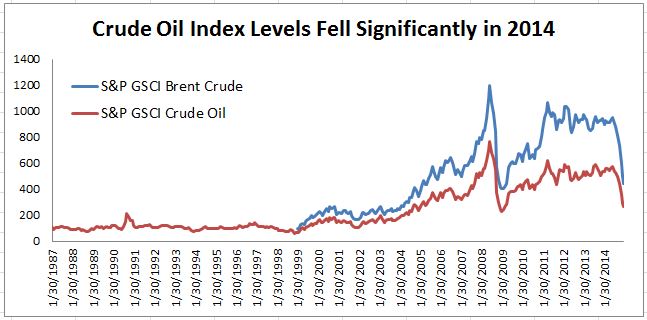 Source: S&P Dow Jones Indices. Data from Jan 30, 1987 to Jan 8, 2015. Past performance is not an indication of future results.