Get Indexology® Blog updates via email.

In This List

The Fed Views a Stronger Economy, Preferred and Investment Grade Corporate Bond Indices Going Strong

Floating Rate Asset Classes

U.S. Municipal Bonds: What a Difference a Year Makes!

The Fed and GDP

Another Fuel In The Fire: The Base Case

The Fed Views a Stronger Economy, Preferred and Investment Grade Corporate Bond Indices Going Strong

Contributor Image
Kevin Horan

Former Director, Fixed Income Indices

S&P Dow Jones Indices

Yields on the 10-year Treasury continued lower last week as measured by the S&P/BGCantor Current 10 Year U.S. Treasury Index.  Friday’s 2.59% is one basis point off from this year’s low of 2.58% of February 3rd.  The index recorded a 2.59% in spite of the fact that the April U.S. Unemployment rate reached a low of 6.3%, a level not seen since 2008.  The Ukraine crisis and the Fed’s near zero interest rate policy continued to keep yields low.  Wednesday’s conclusion of the FOMC meeting resulted in continued stimulus reduction and stating growth in economic activity has picked up recently after being effected by the harsh winter conditions.

Domestic economic news will be quieter than weeks past as the calendar is light.  Today’s Markit U.S. Services PMI was slightly higher at 55 (54.5 expected).  Treasuries sold off on the news after having been higher from news of weakness in China’s manufacturing sector.  March’s Trade Balance is scheduled for tomorrow while MBA Mortgage Applications (-5.9% prior) is due on Wednesday.  Initial Jobless Claims (325k expected) and March’s Wholesale Inventories (0.5% expected) will close out the week.

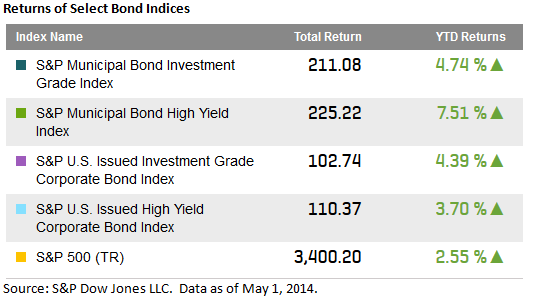
So far 2014 is off to a good start for investment grade corporates.  The S&P U.S. Issued Investment Grade Corporate Bond Index has not had a down month yet and has returned 0.45% for May.  Year-to-date this index has returned 4.54%, 80 basis points more than high yield.  All industry sectors except for catalog retail are contributing positively to the index with the top performing sectors being electric utilities, diversified banks and integrated telecommunications.

The S&P U.S. Issued High Yield Corporate Bond Index has returned 0.08% so far for May after having returned only 0.67% for the month of April.  To date, the best performing month has been the 1.92% in February.  Year-to-date high yield has returned 3.74%.

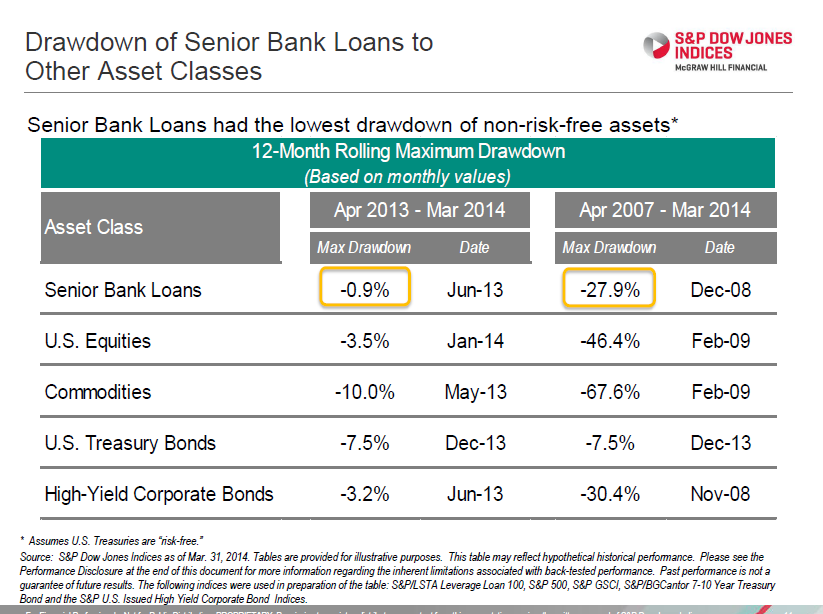
The tone in the market improved over the past week as the S&P/LSTA U.S. Leveraged Loan 100 Index has returned 0.19% month-to-date and 1.33% year-to-date.  Last week the long-anticipated bankruptcy filing of Energy Future Holdings (formerly known as TXU) occurred.  The S&P/LSTA U.S. Leveraged Loan 100 Index holds two loans which accounted for a 0.03% weight within the index.  The loans will remain in the index though not contribute to its yield measures.


The S&P U.S. Preferred Stock Index [TR] so far has returned 0.21% for May and year-to-date has returned 9.15%.  Like investment grade corporates, this index has not had a losing month this year.  January and February were well above 2% while March and April both returned 1.8%.  Longer duration issues in positively performing names such as Royal Bank of Scotland, American Homes and General Electric have increased the returns of this index.

Source: S&P Dow Jones Indices, Data as of 5/2/2014, Leveraged Loan data as of 5/4/2014.


The posts on this blog are opinions, not advice. Please read our Disclaimers.

Floating Rate Asset Classes

Contributor Image
J.R. Rieger

Former Head of Fixed Income Indices

S&P Dow Jones Indices

In the weekend Wall Street Journal (May 3, 2014) there is an informative article entitled “The Risks of Floating Rate Funds”.  The article does a great job of delving into the risks of these types of structures and is quite timely as the low rate environment continues. The investor appetite for floating rate assets while facing the prospect of future rising interest rates is a fascinating topic. The goal of this blog is to add some information in to the discussion.

The volatility of the senior loan asset class is an important topic.  There certainly was a volatile time period during 2008 and 2009 for the financial markets.  The S&P/LSTA U.S. Leveraged Loan 100 Index tracking the senior loan market saw a dramatic decline in value in 2008 of just under 28%.  It may be valuable to also consider the environment and compare that drop in value to other asset classes during that time period: the S&P 500 Index was down over 46%, the S&P GSCI was down over 67% and high yield corporate bonds were down over 30%. During the twelve month period of ending April 2014 the senior loan market experienced a maximum decline of 0.9% while the other markets have experienced larger negative swings.

Source: S&P Dow Jones LLC. Data as of March 31, 2014.

Source: S&P Dow Jones LLC. Data as of March 31, 2014.

Echoing an important point raised in the Wall Street Journal article is the aspect of interest rate ‘floors’. During this low rate environment the interest rate paid out by many senior loans has been held to minimums or ‘floors’.  The interest rate of these floating rate loans are tied to benchmark rates, typically LIBOR, that have dropped significantly.  As of year end 2013, approximately 80% of the loans in the S&P/LSTA U.S. Leveraged Loan 100 Index have some type of interest rate floor.  For the interest rate on those loans to rise the benchmark rate, LIBOR, needs to rise to a point where the rate (LIBOR plus spread) breaks through that minimum rate or the ‘floor’ of these loans.  The key aspect of this is when the rate does rise enough to be above the interest rate ‘floor’ the lenders get the benefit of a rising rate. Meanwhile, the loans with floors are earning above market yields due to the ‘floor’.

There are many other aspects of risk and reward related to the senior loan and high yield corporate bond markets that can be discussed in additional posts.

The posts on this blog are opinions, not advice. Please read our Disclaimers.

U.S. Municipal Bonds: What a Difference a Year Makes!

Contributor Image
J.R. Rieger

Former Head of Fixed Income Indices

S&P Dow Jones Indices

Data as of May 1, 2014

2013 was a not a fun year for municipal bond investors with bond prices and returns being pushed down by events in Detroit and Puerto Rico. 2014 is a different story, demand has shifted back to municipals as the S&P Municipal Bond Index has recorded a 4.91% total return, year to date. Yields of municipal bonds have come down at a faster clip than their counterparts in the U.S. Corporate bond markets. Since year end, investment grade municipal bonds tracked in the S&P National AMT-Free Municipal Bond Index has seen its yield drop to 2.24% (down 87bps) while the S&P U.S. Issued Investment Grade Corporate Bond Index yield ended at 2.82% (down 28bps). High yield municipal bonds, Puerto Rico and Tobacco Settlement bonds while volatile this year have shown strength as investors continue to seek incremental yield over low rate alternatives.

Municipal Bond Returns 2013 & 2014 YTD

Returns of Select Asset Classes 05 01 2014

The posts on this blog are opinions, not advice. Please read our Disclaimers.

The Fed and GDP

Contributor Image
David Blitzer

Former Managing Director and Chairman of the Index Committee

S&P Dow Jones Indices

On Wednesday morning the US Bureau of Economic Analysis reported disappointing numbers for first quarter GDP with real growth a scant 0.1% at annual rates – essentially zero.  The same day the Fed reported on its two day policy meeting stating that the economy continues to improve and, as a result, the reductions in quantitative easing will continue.  Commentators are wondering if the Fed somehow didn’t see the GDP numbers or is suddenly not worried about low inflation and the weak labor market.

Rest assured that the Fed does read the GDP numbers, probably more closely than most people do. The headline GDP was nasty but there are some explanations. Exports fell sharply indicating weak economies abroad.  Cold weather was also a factor, probably contributing to the decline in inventories.   Consumer spending grew by about 2%, certainly not a big gain but almost ok. Moreover, consumer spending grew less in January than February and less in February than March.  Monthly patterns within the quarter can have a surprising impact on quarterly GDP.  To calculate consumer spending first quarter growth, one divides the first quarter dollar value of consumer spending by the figure for the fourth quarter of last year.  The quarterly number is average of the the three monthly numbers. If the first quarter consumer spending consisted of no growth in January or February followed by a jump in March the average would be lower than if the growth was front loaded in January followed by two flat months. The first quarter consumer spending was tilted towards much more growth in March so the averaging understated the strength.  The really bad GDP news was the poor results in housing and business investment, both are a real concern. So, digging into GDP, things were a bit better than they appeared, though not wonderful.

There are other reasons for the Fed to continue the process of ending quantitative easing.  QE, even at reduced levels, is boosting asset prices of bonds, stocks and houses. Were the Fed to halt the QE wind-down we would be back to talking about bubbles.  Second, aside from bubbles, the Fed would like to move back to a more normal monetary policy regime where it can reassert its control of interest rates. We have a long way to go and the first step is to do away with QE.

The posts on this blog are opinions, not advice. Please read our Disclaimers.

Another Fuel In The Fire: The Base Case

Contributor Image
Jodie Gunzberg

Former Managing Director, Head of U.S. Equities

S&P Dow Jones Indices

Finally, in April, commodities got hot enough to turn around even the base metals (also known as the industrial metals,) up 1.8% for the month. Although this comeback is not driven by the main supply shocks we are experiencing in energy and agriculture, it is fundamental in nature.  China’s State Reserves Bureau (SRB) is now buying copper in a big way for the first time since 2009.  Also, Indonesia‘s ban on exports of nickel ore has driven it to be the best YTD performer in the S&P GSCI, up 31.6%, only behind coffee, which has gained 81.0%.

While nickel has been up all year, its performance was exceptional in April with a gain of 15.2%, the biggest in the S&P GSCI for the month. All of the other commodities in the base metals sector were also positive with the exception of copper, which has at least stopped bleeding with 0.0% return in April.  It seems the copper buying has overtaken the fears of slowing Chinese demand growth and credit weakness, and again, is not very highly related to Chinese GDP growth.

What is most interesting about the current performance and term structure of base metals is that the performance turned positive this month and term structure is becoming less in contango. The roll yield, a measure of term structure, is now costing only 90 basis points for the year thus far. This is the lowest since 2007 when the last streak of backwardation ended in the sector.  In fact, going back as far as 1978, there were only two periods when the base metals were in backwardation, 1987-90 and 2004-07.

Source: S&P Dow Jones Indices and Bloomberg. Data from Jan 1978 to April 2014. Past performance is not an indication of future results. This chart reflects hypothetical historical performance. Please note that any information prior to the launch of the index is considered hypothetical historical performance (backtesting).  Backtested performance is not actual performance and there are a number of inherent limitations associated with backtested performance, including the fact that backtested calculations are generally prepared with the benefit of hindsight.

In these periods the average annual premium was 17.9%  with an average return annually of 49.7%. The majority of times for the S&P GSCI Industrial Metals are in contango with an average cost of 5.2%. However, when there is backwardation, it is potent as you can see especially in the 80’s when the sector was up 560.5%, more than three times the still attractive 164.0% just before the crisis.  In these times, the S&P GSCI Total Return was up 182.6% and 65.9%, respectively.

Now may be the turning point for the base metals given the flattening term structure driven by supply shocks and demand pickup. If this is the case, it may just be another fuel in the fire for commodities this year.


Source: S&P Dow Jones Indices and Bloomberg. Data from Jan 1978 to April 2014. Past performance is not an indication of future results. This chart reflects hypothetical historical performance. Please note that any information prior to the launch of the index is considered hypothetical historical performance (backtesting). Backtested performance is not actual performance and there are a number of inherent limitations associated with backtested performance, including the fact that backtested calculations are generally prepared with the benefit of hindsight.

The posts on this blog are opinions, not advice. Please read our Disclaimers.