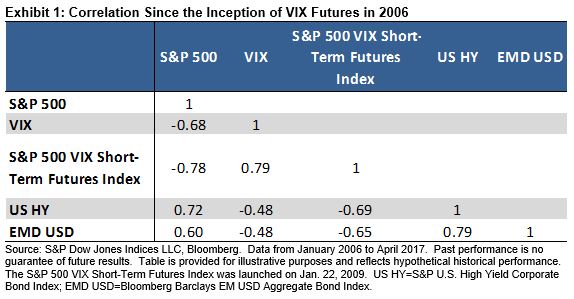
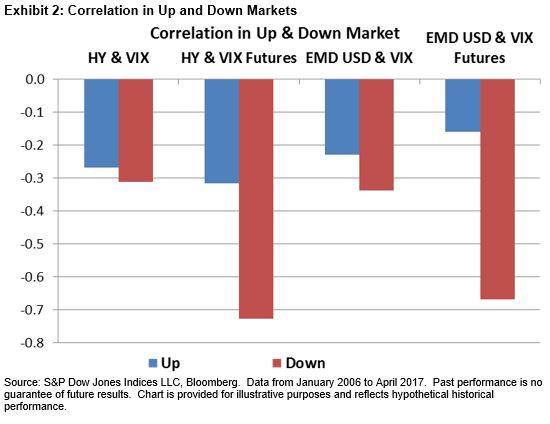
Recently my colleague wrote about the correlation between VIX (spot and futures) and two credit sectors (high-yield and emerging market bonds). The blog shows that VIX futures exhibit stronger negative correlation than VIX spot and that this stronger negative correlation of bonds to VIX futures than to VIX spot comes mostly from down markets. In this blog, we further explore the asymmetric correlation between VIX futures and those two credit sectors.
Not limited to VIX, futures markets in general do not tend to move with the spot in the same magnitude. On rare occasions, the two may even move in opposite directions. When trading futures, market participants need to take into account an additional cost, the so-called “cost of carry,” of maintaining or holding a position in the market. The cost of carry can appear in different ways, including interest on bonds, storage cost of commodities, and, in the VIX futures market, roll cost of futures contracts.
The stronger negative correlation of credit bonds to VIX futures than to VIX spot could be explained largely by the change in the futures curve when VIX spikes. In other words, when the high-yield and emerging bond market is in distress, VIX goes up and the VIX futures curve flips from contango to backwardation, which causes VIX futures to move even further in the opposite direction of the high-yield and emerging market bonds.
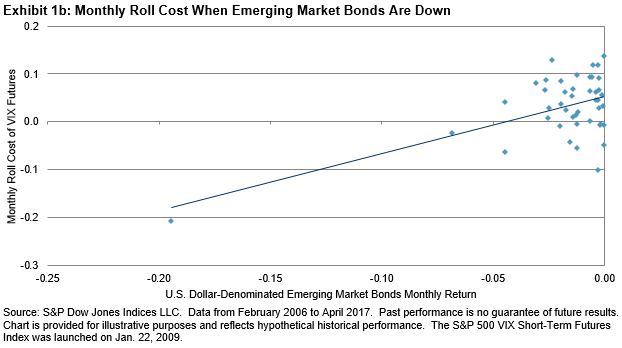
To verify this conjecture, we calculated the monthly average roll cost of the S&P 500® VIX Short-Term Futures Index as the monthly average slope between the first-month futures and the second-month futures. A positive roll cost indicates cost while a negative roll cost indicates yield.
Exhibits 1a and 1b show the monthly roll cost of the S&P 500 VIX Short-Term Futures Index in the months when high-yield and emerging market bonds posted losses between February 2006 and April 2007. When high-yield bonds were down, the correlation between their monthly return and the monthly roll cost of VIX futures was 75%, indicating that the VIX futures curve was more likely to be in backwardation. When emerging market bonds were down, the correlation between their monthly return and the monthly roll cost of VIX futures was 56%, also an indicator of backwardation in the VIX futures curve.
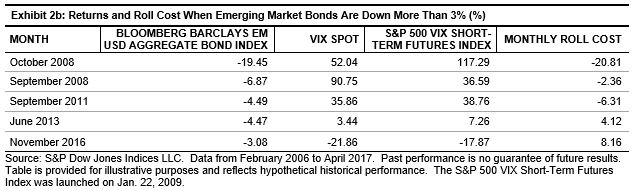
Exhibits 1a and 1b also show that larger loss in high-yield and emerging market bonds was usually associated with higher roll yield from VIX futures backwardation. This is further illustrated in Exhibits 2a and 2b; in the months that high-yield and emerging market bonds posted a loss of more than 3%, VIX futures ten ded to rise, sometimes even more than the VIX spot, due to the backwardation in the VIX futures curve (or, in other worlds, the yield from the roll of a long VIX futures position).
From the above observation, we conclude that backwardation in the futures term structure explains the stronger correlation between VIX futures and these two bond sectors in down markets.