Get Indexology® Blog updates via email.

In This List

Correlation Analysis of VIX® and High Yield and Emerging Market Bonds

Chinese Growth Concerns Weigh Heavy on Metals

Playing catch-up: Investors lag behind corporations in adopting sustainability principles

Carbon Exposure of Smart Beta Indices

DJSI – A temperature gauge for Sustainability Investing

Correlation Analysis of VIX® and High Yield and Emerging Market Bonds

Contributor Image
Hong Xie

Former Senior Director, Global Research & Design

S&P Dow Jones Indices

The CBOE Volatility Index® (VIX) measures the implied volatility of the S&P 500® over a 30-day period.  It is widely followed by market participants across asset classes to gauge market sentiment.  Traditionally, fixed income market participants have incorporated it into macro analysis.

Can VIX-related products be used as hedging tools for some bond sectors that exhibit certain equity-like features?  For high yield and emerging market bonds, credit and liquidity risks are more defining than duration risk.  Dor and Guan (2017) demonstrated that equity futures can be used to hedge high yield portfolios.  We investigated a correlation analysis of high yield and emerging market bonds to VIX and VIX futures.

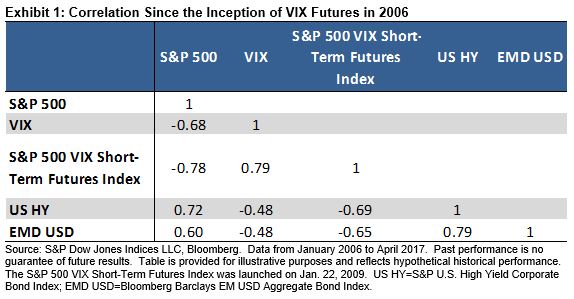
Based on the correlation analysis, we can make the following observations.

There is a strong correlation between high yield and emerging market bond returns (0.58 and 0.79).  This could be due to the fact that emerging market countries and corporations that issue U.S. dollar-denominated bonds are likely to be closely tied to the strength of the U.S. economy and U.S. companies.  The overlapping investor base for high yield and emerging market bonds may also compound the return correlation between these two sectors.

There is a strong correlation between high yield and emerging market bonds and the S&P 500.  In other words, returns from U.S. large-cap stocks can explain a large part of variance in high yield and emerging market bond returns.  In our observation period, 51% of (square of correlation) variance in high yield bond returns and 36% of variance in emerging market bond returns can be explained by the variations in the returns of U.S. equities.

There is a negative correlation between VIX and VIX futures and high yield and emerging market bonds.  This demonstrates that as high yield and emerging market bonds have more exposure to credit spreads than duration risk, they tend to exhibit more equity-like properties and a strong correlation with equity volatility.

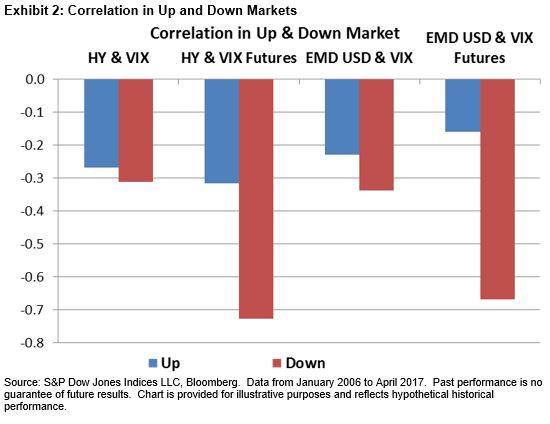
It is noteworthy that VIX futures exhibits stronger negative correlation with credit bonds than VIX spot, and therefore argues for a stronger case of VIX futures as a hedging instrument for bonds.  In fact, when correlation analysis is conducted for up and down market periods separately, it can be seen that this stronger negative correlation of bonds to VIX futures than to VIX spot comes mostly from down markets (see Exhibit 2).

The posts on this blog are opinions, not advice. Please read our Disclaimers.

Chinese Growth Concerns Weigh Heavy on Metals

Contributor Image
Jodie Gunzberg

Former Managing Director, Head of U.S. Equities

S&P Dow Jones Indices

Industrial metals hit multi-year highs last month with the S&P GSCI Industrial Metals Index up off its bottom nearly 60%.  This was mainly due to strong Chinese demand growth and a falling US dollar.  While the dollar has continued its fall in September, there is some concern over slowing growth in China.  On average, returns of energy and metals are resistant to drops in Chinese GDP growth.

Source: S&P Dow Jones Indices

However, industrial metals is the sector falling most often concurrently with slowing growth, falling together in over 60% of the time, and is the only sector that falls more frequently with slowing growth than it rises with rising growth.  Last Thursday, China reported its slowest growth in investment in nearly 18 years and the industrial metals has lost 3.1% in the first half of the month.  Nickel lost 6.0%, copper lost 4.1% and zinc fell 3.6%.  Aluminum and lead lost a respective 1.5% and 1.3%.

The growth concerns seem to have overpowered the inflation growth that usually boosts commodities.  Energy is the most inflation sensitive sector since it is the most volatile component of CPI, though industrial metals don’t get helped enough to outpace the demand growth concerns.  For every 1% rise in Chinese CPI, industrial metals have only risen 2.6% on average.

Source: S&P Dow Jones Indices and investing.com. Monthly year-over-year data ending Aug. 31, 2017.


The posts on this blog are opinions, not advice. Please read our Disclaimers.

Playing catch-up: Investors lag behind corporations in adopting sustainability principles

Contributor Image
Aris Prepoudis

CEO

RobecoSAM

When I was a teenager growing up in Basel, I witnessed first-hand one of the events that put sustainability thinking on the agendas of the corporate landscape. On November 1, 1986, I was woken up by loud sirens. A disastrous fire had broken out at a chemical plant warehouse. Over 1,000 tons of agrochemical product and quicksilver had caught fire. The fire department was quick to contain the fire, but the water it used to extinguish it flowed into the Rhine. Overnight, the contaminated water turned the river a bright red color and caused unprecedented fish mortality.

Events such as these brought awareness of business risks, predominantly environmental risks, to the fore. Sustainability thinking had landed on the agendas of corporate executives!

Initially, it assumed a narrow interpretation of risk-management pertaining to environmental aspects. In other words, it was purely focused on what needs to be done to prevent operating licenses being revoked. However, over time, corporations began to see and enjoy the broader set of business opportunities that integrating sustainability practices more deeply can unlock. It is no wonder that the number of companies that actively participate in our Corporate Sustainability Assessment (CSA), an annual ESG analysis of over 3,900 listed companies, in order to secure a spot in the coveted Dow Jones Sustainability Indices, has continued to increase over the years.

Gradually, and with somewhat of a time-lag, sustainability thinking spread from the corporate sector to the investor community (see Chart 1). Despite this, the way in which the financial sector has embraced sustainability follows a very similar pattern to that of the corporate world.

When investors began to address the challenge of sustainability, the predominant focus was on risk management. Sound familiar? Specifically, they were focused on avoiding controversial investments. Exclusions were the natural answer, but in time and in much the same way as it happened in the corporate sector, this preliminary sustainability thinking evolved. The opportunities that come along with a deeper integration of sustainability principles now also became obvious to investors: identifying more innovative business models, attractive investments, better performance, to name a few. And while exclusionary screening is still the most widely applied Sustainability Investing strategy, more sophisticated strategies are rapidly gaining traction (see Chart 2).

Source: 2016 Global Sustainable Investment Review

Today, some say that integration of ESG in finance has become mainstream. Certainly, leaps and bounds toward a more sustainable approach to business have been made, but we have not yet reached a point where sustainability principles have permeated all the norms, be it in finance or in other sectors. That is the beacon we must continue to strive towards and we must be patient, persistent and rigorous in our endeavor.

Important legal information: The details given on these pages do not constitute an offer. They are given for information purposes only. No liability is assumed for the correctness and accuracy of the details given. The securities identified and described may or may not be purchased, sold or recommended for advisory clients. It should not be assumed that an investment in these securities was or will be profitable. Copyright© 2017 RobecoSAM – all rights reserved.

The posts on this blog are opinions, not advice. Please read our Disclaimers.

Carbon Exposure of Smart Beta Indices

Contributor Image
Kelly Tang

Former Director

Global Research & Design

Carbon emission awareness has been gaining greater prominence on many market participants’ radar as they continue to seek and demand carbon emission information and related risks for companies associated with climate change.  To address this need, the Financial Stability Board taskforce recently published a series of recommendations on how companies should report climate-related risks and opportunities.  The guidelines have already been endorsed by a host of blue-chip firms in addition to the Carbon Disclosure Project.

Index providers are recognizing the need for increased environmental information disclosure and are working to make carbon emission statistics readily available for any benchmark, not just for those indices that are associated with the specific purpose of carbon efficiency.  The S&P Dow Jones Indices Carbon Emitter Scorecard that was released in April 2016 took the first step in providing various emission statistics for headline regional indices in addition to detailing sectoral emissions based on GICS® sector classifications.

An area that tends to be overlooked and less explored in regard to carbon data is the carbon footprint of factor indices.  This is particularly important in light of increasing adoption of and allocation of capital to smart beta strategies by market participants.  For those already implementing factor-based asset allocation and wishing to be aligned with the two-degree investing initiative, it is important to understand a portfolio’s carbon exposure.  Therefore, in this blog, we explore the emission statistics for the five major S&P 500® factor indices: the S&P 500 Low Volatility Index, S&P 500 Enhanced Value Index, S&P 500 Quality, S&P 500 Momentum, and S&P 500 Dividend Aristocrats®.

Emissions are typically measured by mass of carbon dioxide equivalent (CO2e), whereby the equivalent is a proxy applied to greenhouse gases other than carbon dioxide and reflects their relative environmental impact.  The units of reference are in kilotons of CO2e.[1]  Exhibit 1 shows the total direct emissions for each of the S&P 500 Factor Indices referenced previously in addition to the benchmark.

The results highlighted some interesting findings, one of which showed that the low volatility factor generated the highest total in emissions due to its strong utilities sector presence.  The S&P 500 Low Volatility Index has 17 utilities companies, generating over 60% of its direct carbon emissions.  This finding (that low volatility indices tend to have a high carbon emission bias) presents potential solutions from the index provider perspective and allows them to incorporate a carbon efficiency component to low volatility indices.

Conversely, the quality factor had the lowest carbon emissions.  The S&P 500 Quality had zero exposure to utilities and negligible allocation to energy.  The quality strategy’s contribution to CO2e emissions stemmed from its high industrials exposure (10% overweight versus the benchmark).  Industrials ranked high in the quality index due to the sector’s strong profitability growth as it benefits from the uptick in the business cycle.  The industrials component contributed more than 52% of the S&P 500 Quality’s total direct emissions (see Exhibit 2).

Lastly, the financial sector was the second-highest contributor of CO2e emissions for the enhanced value and momentum strategies, which at first glance, may appear somewhat out of the ordinary.  However, Berkshire Hathaway constituted 6.5% of the S&P 500 Momentum and 3.9% of the S&P 500 Enhanced Value Index, ranking as the second and fifth top holding in those respective indices.  Its portfolio company, Berkshire Hathaway Energy, generated 99% of the financial sector’s total CO2e emissions in the momentum and enhanced value strategies.

Understanding the carbon exposure of smart beta strategies is important for market participants who are already implementing smart beta strategies and wish to incorporate carbon risk into the investment process.  Our analysis shows that factors such as low volatility and value may be predisposed to higher carbon emissions because of their sector compositions.

[1] Emissions data is sourced from Trucost, which provides data on both direct and first-tier indirect emissions on a company-by-company basis; if companies do not report or otherwise make such figures available, Trucost estimates the emissions of each company using a proprietary model.  Direct emissions, as the name suggests, encompass emissions of CO2e produced directly by the entity, whereas indirect emissions are those that arise from the entity’s suppliers of materials and equipment, utilities such as electricity, and business travel.  The inclusion of indirect emissions is not always preferable, especially in an index, as this may result in double counting.  For example, if a utility company and one of its customers were included in the same index, the emissions of the latter would be counted twice.

The posts on this blog are opinions, not advice. Please read our Disclaimers.

DJSI – A temperature gauge for Sustainability Investing

Contributor Image
Aris Prepoudis

CEO

RobecoSAM

On September 7, the review of the renowned Dow Jones Sustainability Index (DJSI) series will be announced. Now in its 19th year, the index family continues to be the gold standard of large cap ESG performance, and serves as an effective engagement platform for investors who want to encourage companies to improve their corporate sustainability practices.

As sustainability thinking grew in popularity, what started out as a single index, the DJSI World in 1999, gave birth to a number of regional index family members such as the DJSI Europe, the DJSI North America, and DJSI Emerging Markets, as well as a number of other index families such as the DJSI Diversified and S&P ESG Factor Weighted indices.

But it is really only very recently that we can speak of a real boom for ESG indices. The current economic and political climate combined with growing environmental concerns have spurred investors to more seriously consider Sustainability Investing. They recognize that companies with strong ESG performance make sustainable long-term investments, and that Sustainability Investing does not mean sacrificing performance.[1] And for those seeking a passive investment solution that integrates sustainability thinking, ESG indices are a natural fit.

Growth in ESG indices across regions and strategies demonstrates that global investors are exploring ways to integrate ESG factors into their investments – aiming to generate not only positive return but also positive impact. Indices are often used by global sustainability investors to define the investment universe for their region of interest and test out investment strategies with ESG indicators.[2]

Furthermore, the increasing popularity of ESG indices also reflects improved ESG disclosure and provides motivation for companies to disclose more and higher quality data, including material non-financial information, to compete with their peers. This is something that we at RobecoSAM witness first-hand via the Corporate Sustainability Assessment (CSA), our annual ESG assessment of over 3,900 listed companies. The data we collect has a multitude of uses, one of which is to determine the components of the DJSI. Participation rates in the CSA were a record high this year, with many new companies from markets where ESG is quickly gaining traction.

Investors and companies are eagerly awaiting the updated component lists to be published. Which companies will be added or deleted to the indices? What observations can be made about the state of sustainability in the corporate world? What does this mean for Sustainability Investing? These are just a few of questions and topics that the annual DJSI review will address. After all, the DJSI is not just another ESG index family, it is a temperature gauge for the state of Sustainability Investing.

[1] http://www.hbs.edu/faculty/Publication%20Files/SSRN-id1964011_6791edac-7daa-4603-a220-4a0c6c7a3f7a.pdf

[2] https://www.bloomberg.com/professional/blog/esg-indices-bringing-environmental-social-governance-data-fore-asia-globally/

Important legal information: The details given on these pages do not constitute an offer. They are given for information purposes only. No liability is assumed for the correctness and accuracy of the details given. The securities identified and described may or may not be purchased, sold or recommended for advisory clients. It should not be assumed that an investment in these securities was or will be profitable. Copyright© 2017 RobecoSAM – all rights reserved.

The posts on this blog are opinions, not advice. Please read our Disclaimers.