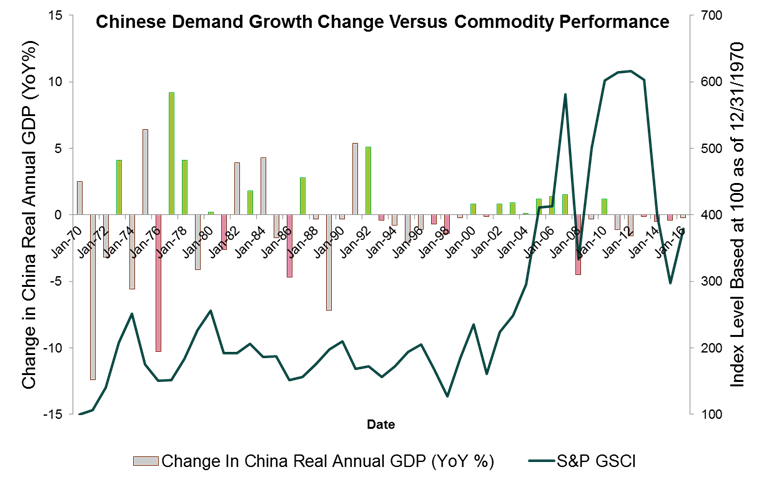
Many news headlines point to rising or falling Chinese demand growth as a main influence of commodity performance. However, there are many other fundamentals like the U.S. dollar and interest rates that drive commodities. Even in the Chinese market, there are forces besides demand growth like demand for storage and demand for metals to be used as financial collateral. So, in this analysis, the impact of Chinese demand growth changes on overall commodities, sectors and individual commodities is examined, using year-over-year data from 1970.
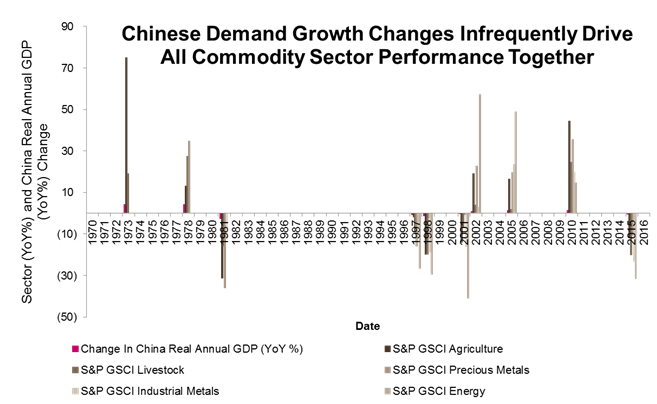
Overall the S&P GSCI only moves in the same direction as Chinese GDP growth changes in about 57% or 26 of 46 years. However, when the Chinese GDP growth is split into rising and falling periods, commodity returns seem to be more influenced by rising growth than slowing growth. Of the 46 years, growth rose 19 times with 15 or 79% positive annual commodity returns. The slowing growth years were much less influential, driving down commodity performance in only 11 of 27 years, or in 41% of time. Though, big negative years like in 1976, 1981, 1986, 2008, and times with consecutive years of falling growth like in 1997-98, 2013-15 seemed to bring commodities down.
Additionally, it is infrequent to see all five sectors move together in the same direction with Chinese GDP growth changes, but again they are more influenced by rising growth. All sectors moved with demand growth in 21.7%, or in 10 of 46 years. However, all sectors gained in 26.3%, or in 5 of 19 rising demand growth years, while all sectors lost in just 18.5%, or in 5 of 26 slowing demand growth years.
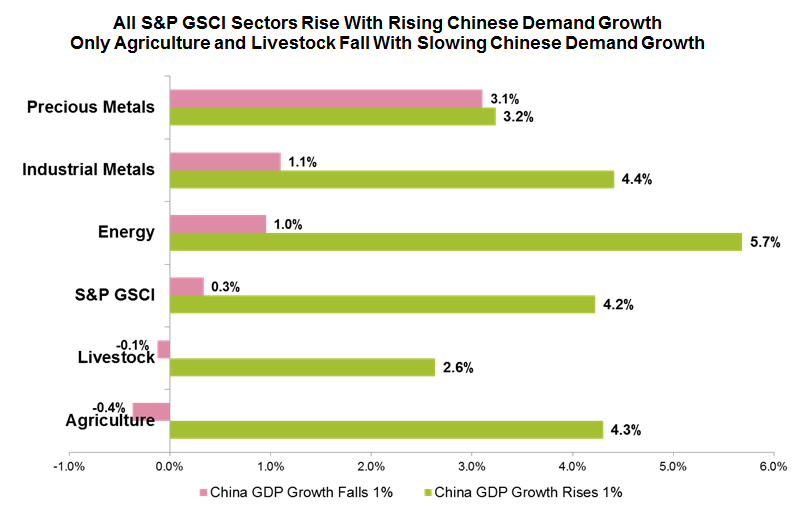
The evidence shows diversification protects the S&P GSCI from slowing Chinese demand growth and helps with rising growth. The composite index loses in just 40.7% of falling growth periods, which is less frequently than any single sector loses with falling growth. It is interesting that industrial metals, which is comprised largely (over 40%) of copper, is the least sensitive sector to rising Chinese GDP growth, rising in just 53% of years together. It is also interesting that energy is the least sensitive to falling growth, dropping together in just 43% of years. The least generally sensitive sectors to macro factors, agriculture and livestock, have historically been most influenced by moves in Chinese GDP growth.

Agriculture and livestock are also the only sectors that lose on average for every 1% drop in Chinese GDP growth. While a 1% rise in Chinese GDP growth helps every sector, a 1% drop in Chinese GDP growth only reduces positive returns overall and for metals and energy. For precious metals, although the direction of returns and Chinese GDP growth changes moves together more frequently up than down, the average returns for a 1% Chinese GDP growth move in either direction is about the same.
Lastly, every single commodity in the S&P GSCI rises with rising Chinese GDP growth, while only wheat, cotton, gasoil, Brent crude and natural gas seem to fall on average with a 1% drop in Chinese GDP growth.
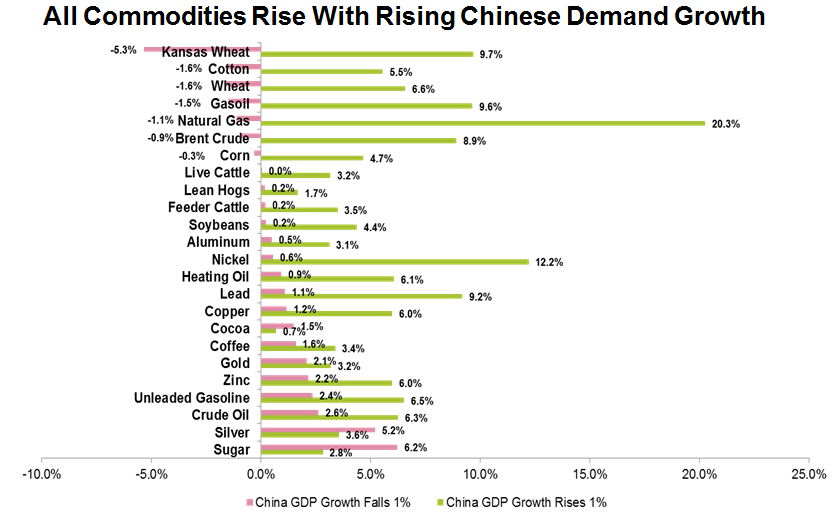
The rise in natural gas may be more coincidental since U.S. supplies accounted for 7% of China’s LNG imports (in March 2017.) Additionally, the World Economic Outlook in October 2015 stated, “Notwithstanding the dramatic increase in Chinese imports of metals, these represent less than 2 percent of China’s GDP.” These regional and commodity specific factors are important to note when realizing potential differences in commodity performance from Chinese GDP growth changes.
The posts on this blog are opinions, not advice. Please read our Disclaimers.