Get Indexology® Blog updates via email.

In This List

Asian Fixed Income: Continuing Rally for Indonesian Bonds

April: A Testing Month for VIX Traders

Diversification and Risk Management

Active Management Underperformance in 2016 Generally Higher Than in Previous Years

Will Oil's Madness Upset Industrial Metals?

Asian Fixed Income: Continuing Rally for Indonesian Bonds

Contributor Image
Michele Leung

Former Director, Fixed Income Indices

S&P Dow Jones Indices

Indonesian bonds, as tracked by the S&P Indonesia Bond Index, gained 5.59% YTD as of April 5, 2017. This is a continuation of the strong growth trend observed in 2016, when the index increased 13.7% owing to the Bank Indonesia’s cut in interest rates on six occasions throughout the year. Indonesia has been one of the top three best-performing countries tracked by the S&P Pan Asia Bond Index over the past three years. Both equities and bonds have been performing well on the basis of solid economic fundamentals.

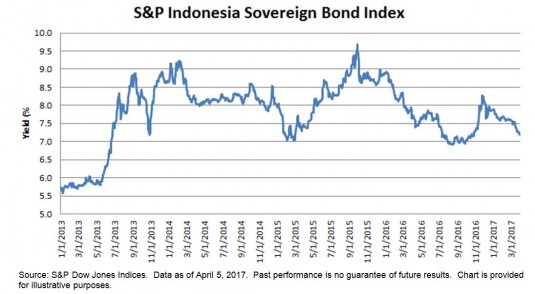
Indonesian government bonds have outperformed corporate bonds over the past year. The S&P Indonesia Sovereign Bond Index was up 6.18% YTD and 11.90% over the one-year period, while its yield also came down 72 bps from 7.88% in December 2016, see exhibit 1.

The S&P Indonesia Corporate Bond Index returned 4.14% YTD and 10.89% over the one-year period. Among the corporate bonds, the utilities sector was the best performer, up 5.38% YTD and 13.86% over the past year; notable contributors were Indosat, TELKOM, and PLN.

The yield-to-maturity of the S&P Indonesia Bond Index tightened 80 bps to 7.07% YTD, and it remains the highest yielding country within Pan Asia YTD, followed by the 7.11% yield of the S&P BSE India Bond Index. As the Indonesian and Indian bonds offer higher yields than their Asian peers which averaged at 4%, they continue to grow in popularity among global investors.

Exhibit 1: The Yield-to-Maturity of the S&P Indonesia Sovereign Bond Index

The posts on this blog are opinions, not advice. Please read our Disclaimers.

April: A Testing Month for VIX Traders

Contributor Image
Berlinda Liu

Former Director, Multi-Asset Indices

S&P Dow Jones Indices

Shorting VIX® was among the top strategies in the past year.  XIV and SVXY both went up over 50% in Q1 2017 (~15% in March alone), almost doubled in the past six months, and returned ~180% over the past 12 months (see Exhibit 1).  However, the declining VIX spot level can only explain part of their performance.

Both XIV and SVXY consistently provide a short exposure to VIX futures, not the spot VIX index.  They are exchange-traded products that track the S&P 500® VIX Short Term Futures Inverse Daily Index, which, as its name suggests, seeks to track the inverse of the S&P 500 VIX Short Term Futures Index.

The S&P 500 VIX Short Term Futures Index takes long positions in the first- and second-month VIX futures contracts.  A proportion of the first-month contract (ticker UX1) is rolled to the second month (ticker UX2) every day to maintain a constant 30-day maturity.  As the second-month futures are usually more expensive than the first month (see Exhibit 2), this long VIX futures exposure usually incurs a loss from the roll (the “roll cost”), while the inverse of this exposure, as provided by the S&P 500 VIX Short Term Futures Inverse Daily Index, usually generates a profit from the roll (the “roll yield”).

The roll cost of the S&P 500 VIX Short Term Futures Index may seem small on daily basis, but in aggregate, it causes the index to go down over a long-term horizon.  In the 12-month period (253 trading days), positive roll cost occurred on 247 days (97.63%).  This is the main driver behind the enormous growth of inverse VIX futures products.

However, April 2017 will be an interesting month for VIX traders for a number of reasons.

First of all, the spread between the first-month and second-month VIX futures contracts has narrowed (see Exhibits 2 and 3).  In addition to the reduction in roll yield of the short VIX futures exposure, the flattening of the VIX term structure usually indicates anxiety being built up in the market.  In a distressed market, the VIX term structure may even become inverted, when the first-month futures become more expensive than those of the second month.

Secondly, the spread between the VIX spot and the 30-day realized volatility of the S&P 500 has tightened.  As the benchmark of implied volatility, VIX is expected to be higher than the 30-day realized volatility of SPX.  A tightened spread often indicates that the market is complacent and a VIX spike is on the way.  When VIX spikes, the inverse VIX futures products usually incur losses.

Finally, risk coming from outside of the U.S., including the upcoming French election, should not be overlooked.  As illustrated in Exhibit 5, the term structure of VSTOXX, a VIX-like index that measures the 30-day implied volatility of the Euro Stoxx 50 index, became inverted over the month of March 2017.  As the European market is getting ready for the April 23, 2017 election, market participants in the states might need to fasten their seatbelts.

The U.S. equity market was resilient after Brexit and the U.S. presidential election, but how it will respond to the results of the French election is yet to be revealed.  April could be an interesting month for all VIX investors, on the long or short side of the trade.

The posts on this blog are opinions, not advice. Please read our Disclaimers.

Diversification and Risk Management

Contributor Image
Koel Ghosh

Former Head of South Asia

S&P Dow Jones Indices

Recently, I attended a session by an expert on good health.  I was pleasantly surprised to learn that besides diet and exercise, emotional and spiritual health is essential to a holistic lifestyle.

When there are many elements to achieving a certain goal, it is of primary importance that each of those elements is included and provided the necessary emphasis.  If we apply this concept to investing, there are so many stocks, categories, and sectors among the various styles, strategies, and themes that it becomes imperative to have the correct mix to help achieve a set investment goal.

This “correct mix,” or “diversification” in financial jargon, is an important technique that is one of the building blocks of a good investment strategy or portfolio.  Most strategies or portfolios aim to maximize return by taking on different exposures that have different characteristics.  The goal is to bring about varied results based on the different reactions to events that these characteristics display.  Let’s take the example of a buffet, which has an elaborate spread starting with salads, then appetizers, the main course, and dessert.  Often, there are local cuisines alongside international ones to provide for various tastes and cater to varied interests.

We can also extend this analogy to investing and indexing.  Depending on the preference or investment goal, a mix is selected in order to avoid overweighting or excessive exposure to one type of asset, stock, or sector.

Diversification can be a useful tool for reaching long-range financial goals while minimizing risk. Investment risk could be interpreted as the probability of suffering a loss, lower returns, higher volatility resulting in additional costs, etc.  The famous saying, “Don’t put all your eggs in one basket,” supports diversification.

Exhibits 1 and 2 help to explain diversification by comparing exposure to a single stock to an index. Exhibit 1 compares the returns of individual auto stocks (Tata Motors in brown, Hero Motor in green, and Bajaj Auto in purple) to the S&P BSE Auto (in blue).  Exhibit 2 shows the S&P BSE SENSEX returns (in blue) in comparison with individual stocks in the index (SBI in green, ITC in purple, and Infosys in brown).  The comparisons bring to light the volatility and risk of single-stock exposure, as they showcase high volatility along with a wide range of returns for the single stocks in contrast to the index, which had less volatility and a more narrow range of returns.

Exhibit 1: S&P BSE Auto Comparison 

Source: Bloomberg.  Data from March 2012 to March 2017.  Past performance is no guarantee of future results.  Chart is provided for illustrative purposes.

Exhibit 2: S&P BSE SENSEX Comparison

Source: Bloomberg.  Data from March 2012 to March 2017.  Past performance is no guarantee of future results.  Chart is provided for illustrative purposes.

These two cases are just examples, and there could be many other scenarios with different stocks, categories, sectors, styles, themes, etc.  Markets go through various cycles and trends, and not all favor any single asset class or category.  Let’s review the heat map for the period ending Dec. 31, 2016, which shows the difference in sector characteristics across time.

Source: Asia Index Pvt. Limited (www.asiaindex.co.in).  Data as of Dec 31, 2016.  Index performance based on total return.  Past performance is no guarantee of future results.  Table is provided for illustrative purposes.

This provides clarity that diversification can hedge the risk of overexposure or bias.  Indexing can be a great route toward diversification, as indices are constructed to be well diversified by a neutral index provider.  Passive investing or investing in an index-linked fund may reap the diversification benefits of a varied exposure across stocks and sectors, potentially minimizing risk.

The posts on this blog are opinions, not advice. Please read our Disclaimers.

Active Management Underperformance in 2016 Generally Higher Than in Previous Years

Contributor Image
Daniel Ung

Former Director

Global Research & Design

European equity markets, as measured by the S&P Europe 350, went up 3.44% in 2016, yet the average performance of active managers invested in Europe was negative, whether measured on an asset-weighted or equal-weighted basis.  Over the one-year period, more than 80% of active managers invested in European equities underperformed their respective S&P DJI benchmark.  This level of underperformance continued into the long run, and more than 88% of managers underperformed over the 10-year period.

A similar pattern was seen in other fund categories.  More than 88% of managers invested in global markets underperformed their respective S&P DJI benchmark over the one-year period, and over 98% trailed it over the 10-year period.  Underperformance was most severe in emerging market equity funds.  Over 93% of actively managed emerging market funds failed to keep up with their S&P DJI benchmark over the one-year period, and all of the emerging market funds studied in the report trailed it over the 10-year period.

Even though the majority of the statistics looked unfavorable for active managers, there were a few notable exceptions.  Nearly all active managers invested in Denmark and Switzerland beat the corresponding S&P DJI benchmarks over the one-year period.  However, this was not repeated over the long run, and the majority of the managers in these categories underperformed the benchmark over the 10-year period.

For the full details of the report, please click here.

The posts on this blog are opinions, not advice. Please read our Disclaimers.

Will Oil's Madness Upset Industrial Metals?

Contributor Image
Jodie Gunzberg

Former Managing Director, Head of U.S. Equities

S&P Dow Jones Indices

Although many analysts anticipated U.S. oil producers would fill the gap from production cuts by OPEC and some non-OPEC producers, not many probably guessed Brent would have its second worst Q1 in history, losing 7.6%, after the implementation of the production cuts.  According to the Information Energy Agency (IEA,) the U.S. saw a triple surge in supply from rising imports and domestic production as well as lower refinery utilization.  Also while the countries in OPEC have complied pretty well with the cuts pledged, non-OPEC countries have been slower to adhere.  The result is it may take significant time for the market to re-balance despite some demand growth.

Source: International Energy Agency, Oil Market Report. March 2017.

With the demand optimism, the S&P GSCI Industrial Metals started the year out strongly, up 9.2% that is its best first quarter since 2008; however, the sector started to slip slightly in March, ending down 94 basis points for the month.  Given oil prices have become a major macroeconomic factor, there is concern the energy sector chaos could spill into the other commodities.

In March, the S&P GSCI Total Return lost 3.9% bringing its year-to-date loss to -5.1%, and the Dow Jones Commodity Index (DJCI) Total Return fell 2.8% for a year-to-date loss of 2.0%.  The S&P GSCI Energy Total Return was the worst performing sector for the month, losing 4.9%, and S&P GSCI Livestock Total Return was the only positive sector in March, gaining 1.2%, to bring its year-to-date performance up to 1.2%.  Not only were 4 of 5 sectors down but only 7 single commodities were positive, which is the fewest number of positive commodities since Nov. 2015. Natural gas was the best performer in the month, up 12.2% from supply disruptions, and also other gainers were aluminum +1.7%, lead +3.6%, cotton +1.4%%, cocoa +9.8%, feeder cattle +7.1% and live cattle +2.7%.  Sugar was the worst performing commodity, losing 12.8% in the index from a favorable production outlook in Brazil and the prospect of a rebound in Indian output next season.

However, sugar inventories are still relatively low and it is not the only commodity with low enough inventories to be in backwardation.  In March, 8 commodities were in backwardation, which is double the 4 singles that were backwardated in Feb, and is also the highest number of backwardated commodities since July 2016.  In addition to sugar, the other commodities in backwardation are coffee, feeder cattle, Kansas wheat, live cattle, silver, soybeans and wheat.

Another bullish sign potentially is the outperformance of industrial metals over energy.  In the first quarter, the spread is 18.8%, the biggest since the premium of 20.7% in March 2009, that was at the bottom for commodities in the global financial crisis .  Given the favorable upside potential to downside risk in energy at this point, there is a chance industrial metals can continue performing if the economic demand can keep pace.  Even though brent had its second worst start to the year along with gasoil, and unleaded gasoline had it worst ever q1 in history,   aluminum posted its second best ever q1 with other strong starts from lead (4th best q1) and gold (5th best q1.)

Source: S&P Dow Jones Indices


The posts on this blog are opinions, not advice. Please read our Disclaimers.