Get Indexology® Blog updates via email.

In This List

Inside the S&P 500: The Real Estate Sector

Pan Asia: Leveraged and Inverse ETFs Have Increased in Turnover

Hot Commodities For Summer After Record Heat In Q2

Stay or Leave, the Brexit Vote Will Have an Impact

S&P U.S. High Quality Preferred Stock Index: A Venn of an Index

Inside the S&P 500: The Real Estate Sector

Contributor Image
David Blitzer

Former Managing Director and Chairman of the Index Committee

S&P Dow Jones Indices

Part of the power of the S&P 500 is analyzing the market and gaining insights into which stocks rising or falling.  The key to these analyses is GICS – the Global Industry Classification Standard – which is used to define the sectors and industries in the index. GICS is jointly maintained by S&P Dow Jones Indices and MSCI.  The classifications are used across the S&P indices so that analysts have a consistent picture whether they look at large cap versus small cap or foreign versus domestic.

GICS goes back to 1999 and divides the world of equities into 10 sectors, 24 industry groups, 68 industries and 157 sub-industries. Because lots has changed since 1999, GICS is reviewed each year to assure that it remains relevant. Among those changes is the increasing interest in investing in real estate through equities and the growing popularity of real estate investment trusts (REITs). REITs are taxed differently from most corporations and are required to distribute a large portion of their income. REITs are seen as attractive income oriented dividend paying investments.

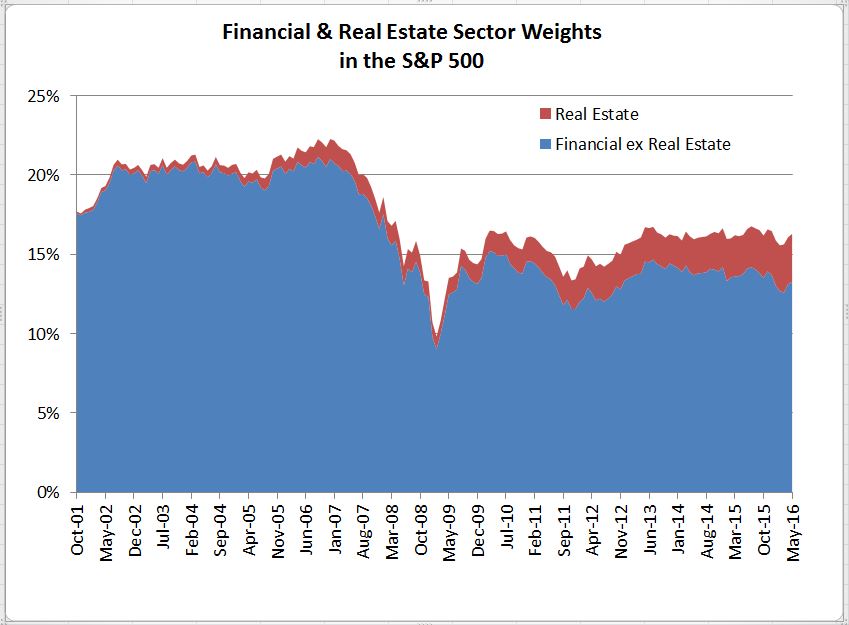
When GICS was introduced in 1999, REITs were considered alternative investments and rarely found in mainstream indices. The initial recognition step came in 2001 when S&P Dow Jones Indices, after a market consultation, decided that REITs would be eligible for inclusion in the S&P 500.  At that time REITs and other real estate development companies were grouped together with the financials under GICS. Periodically investors would suggest that real estate or REITs were lost amidst the banks and brokers and should stand on their own. Over the last few years, as S&P Dow Jones Indices and MSCI reviewed GICS, we heard more and more about real estate and REITs. (The chart shows the increasing real estate share in the S&P 500’s market value compared to financials excluding real estate.) Based on comments from investors, the real estate industry and others, S&P Dow Jones Indices and MSCI announced in March 2015 that real estate would leave the financial sector and become its own 11th sector in GICS.  The move for GICS is at the end of August, the shift in S&P Dow Jones Indices will be the rebalance on September 16th.

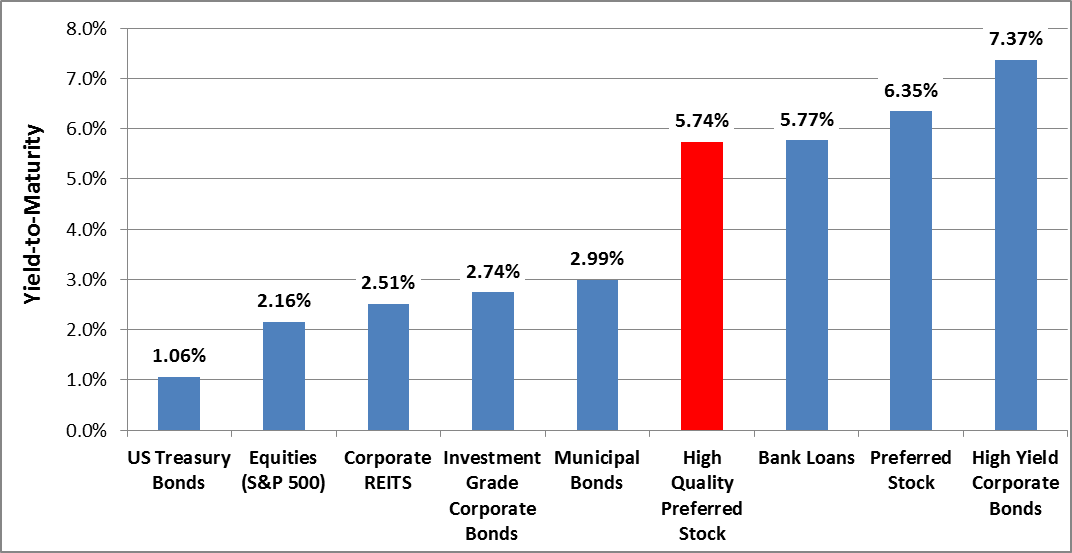
This is not just rearranging the place cards on the table. The GICS sectors are widely used to gauge how asset allocations align with markets. With real estate added to the top line of sectors, investors will notice where real estate is and whether they are over or under weighted. Analyses of market movements and fundamentals will focus on real estate the same way they focus on industrials or technology. With real estate removed from the financials, the reported dividend yield for financials will drop a bit as real estate moves to be among the higher yielding sector in the 11, along with telecommunication services and utilities.

With the change to GICS, real estate and REITs will garner more discussion and ink. Already analysts, ETF issuers and the media are paying increasing attention to the new sector-to-be.  Those who thought the financial crisis ended real estate investing were wrong; real estate and REITs are an important part of the market. With the new GICS sector, REITs will get increased attention. Greater attention is not a guarantee of investment results.

The posts on this blog are opinions, not advice. Please read our Disclaimers.

Pan Asia: Leveraged and Inverse ETFs Have Increased in Turnover

Contributor Image
Ellen Law

Former Associate Director, Asia Pacific Market Development

S&P Dow Jones Indices

In recent years, leveraged and inverse (L&I) ETFs have gained significant traction in Asia. Thanks to the relaxation of listing regulations, more L&I ETFs are listing in Japan, Korea, Taiwan, Australia, and recently Hong Kong.  The number of L&I ETFs listed in Asia is on the rise; it was up to 87 as of June 13, 2016 (see Exhibit 1).

Capture

The underlying indices of L&I ETFs are using different strategies. Leveraged indices are designed to generate a multiple of the return of the underlying index in situations where the investor borrows funds to generate index exposure beyond their cash position.  Inverse indices are designed to provide the inverse performance of the underlying index, representing a short position in the underlying index.

L&I ETFs Drive Turnover in Asia

The growth of AUM and the turnover of L&I ETFs have outpaced those for other non-L&I equity ETFs in the Pan Asia region. This year, the AUM of L&I ETFs grew 6.8%, while other equity ETFs only increased 2.8%.  The turnover of L&I and non-L&I equity ETFs showed a significant difference, with -7.1% and -61.9%, respectively.*  It is worthwhile to highlight that the amount of AUM of L&I ETFs in the Pan Asia region is rather low, but the turnover is high when compared to other equity ETFs.  According to the data released by the Taiwan Stock Exchange, ETF turnover in Taiwan has increased by 45% to 299.5 million units (YoY 2015), and this growth was mainly driven by the strong demand of L&I products.  Taking a look at the bigger picture in Pan Asia, L&I ETFs only represent 5.9% of the total AUM, but they garnered 53.2% of total turnover and thereby bolstered the market liquidity (see Exhibit 2).

Capture

Hong Kong Opens Door for L&I Products

To tap into Asian demand for L&I products, Hong Kong finally opened its doors to allow the listing of those products. The first batch of L&I products have been launched in Hong Kong to bet on and against mainly overseas markets, given that only non-Hong Kong and non-mainland indices were eligible originally.  There are other L&I products in the pipeline, and they are expected to come to the market soon.  Hong Kong has long been thought of as a market with a lack of product innovation and has fallen behind Tokyo and Shanghai by turnover in the region.  With the new L&I listings in Hong Kong, we will see if its market can follow in the examples of Japan, Korea, and Taiwan in their boosting of ETF turnover.

L&I ETFs are becoming more popular, as they may serve as trading tools for investors to potentially amplify returns regardless of market direction. However, investors should be aware that L&I products, unlike conventional ETFs, are designed for short-term trading and associated with potential risks such as daily compounding and daily rebalancing.

The posts on this blog are opinions, not advice. Please read our Disclaimers.

Hot Commodities For Summer After Record Heat In Q2

Contributor Image
Jodie Gunzberg

Former Managing Director, Head of U.S. Equities

S&P Dow Jones Indices

As the second quarter’s end nears, commodities are on pace to post their best quarter in seven years. The S&P GSCI Total Return is up 14.6% quarter-to-date (as of close on June 29, 2016,) the most since its quarterly gain of 19.2% in the second quarter of 2009.  So far in q2 2016, 12 of 24 commodities have returned over 10% with energy gaining 22.2% QTD.  The best performers for the quarter are sugar and natural gas up 34.3% and 28.3%, respectively.  Natural gas, brent crude and gasoil are on track to record their 8th best quarter in history.

Source: S&P Dow Jones Indices.

Despite, a record hot second quarter, commodties may continue on their streak into the summer given the 3rd quarter is historically the best one for the asset class. On average since 1970, the S&P GSCI TR has gained 4.3% in Q3 that is more than the average historical returns of 2.8%, 3.0% and -0.7% in Q1, Q2 and Q4, respectively.

For seven commodities, the 3rd quarter has historically been the best quarter but the 3rd quarter has been the worst for six commodities.  Also, the 3rd quarter has been the best for both energy and precious metals with respect to their own histories. Based on the table below, commodities including cocoa, crude oil, gold, heating oil, wheat and lead may heat up this summer while aluminum, corn, cotton, natural gas, nickel and soybeans may cool off (though it is interesting to note that even in the worst quarter for soybeans, they still gained 3 basis points on average.)

Source: S&P Dow Jones Indices

However, for relatively hot plays in the space, unleaded gasoline (q1 is historically its best quarter gaining 9.2% on average,) lead, heating oil, crude oil, wheat, gold and silver have outperformed the index in past 3rd quarters. SImilarly to the table above, the same commodities that have had the worst performance relative to themselves also have had the worst performance compared with other commodties. For a sector play, energy may be the best outperformer based on its summertime history.

Source: S&P Dow Jones Indices

Important fundamentals to watch are U.S. inventories and supply for oil, driving demand for unleaded gasoline, El Nino impacts for agriculture and natural gas, seasonal grilling demand, unexpected supply shocks that may bring inflation, dollar moves and Brexit.


The posts on this blog are opinions, not advice. Please read our Disclaimers.

Stay or Leave, the Brexit Vote Will Have an Impact

Contributor Image
Howard Silverblatt

Senior Index Analyst, Product Management

S&P Dow Jones Indices

The latest weekend survey by the Daily Mail predicted the outcome of the June 23, 2016, U.K. vote in the “stay” column 45%-42%, as European markets either ralied or rebound on the news—depending on their timing and view of the situation.  The vote, which has been talked about for a while, came to the front burner last week, as the possibility of a “go” vote emerged, and markets reacted to the potential of significant European disruption in financing, trade, and labor.  The European impact will be significant, regardless of the vote, given the split among the voters and politicians and the mostly one-sided “stay” among business leaders.  Market volatility and an increase in trading is expected—again, regardless of the outcome—with the action taking effect globally.

A vote to stay will not end the debate, but could disrupt markets less, as the status quo permits business to continue.  In the longer term, since the issues would not stop with a “stay” vote, the ability of companies to commit to business plans (be it capital expenditures, hiring, M&A, or financial) could be impaired.

A vote to go could bring years of uncertainty, as the process to decouple would start, along with expected higher market (and political) volatility.  The best analogy at this point appears to be that a “go” vote would be similar to getting a divorce with no prenuptial agreement.  Issues of separation, use, and ownership of assets, rights, and labor would each need to be worked out by the overseeing agencies (and politicians).  The uncertainty in the short term could cause a disruption in business operations, as trade and travel would have to be negotiated.

From this side of the pond, the impact on U.S. stocks might be considerably less, but a knee-jerk reaction could be expected, with a prolonged one for a “go” vote.  Overall, S&P 500® companies derive 45% of their sales from abroad, with approximately 8% of all sales from Europe.  U.K. sales have been on the uptick this year and account for approximately 25% of the European sales (2% of all S&P 500 sales).  Reporting on foreign sales in the U.S. is poor to say the least, with only one-half of the companies giving detailed information.  Even among those that report, a country breakdown is typically not given.  That said, Exhibits 1 and 2 show some of the issues that are more exposed to U.K. sales, along with those with exposure in Europe.

Capture

Capture

The posts on this blog are opinions, not advice. Please read our Disclaimers.

S&P U.S. High Quality Preferred Stock Index: A Venn of an Index

Contributor Image
Kevin Horan

Former Director, Fixed Income Indices

S&P Dow Jones Indices

Similar to the Venn diagram in which the overlapping section of circles is the focus, the S&P U.S. High Quality Preferred Stock Index is designed to measure preferred securities that are constituents of both the fixed-rate and investment-grade preferred stock indices.

Exhibit 1: S&P U.S. Preferred Stock Indices Hierarchy

Source: S&P Dow Jones Indices LLC. Data as of June 17, 2016. Chart is provided for illustrative purposes.

The weight of cumulative preferred stocks is set at 75%, while the weight of the non-cumulative category is set at 25%, subject to issuer limit.  Within each category, securities are equally weighted.  To reduce concentration risk, the maximum weight of each issuer is capped at 22.5% at each quarterly rebalancing.

As of June 17, 2016, the S&P U.S. High Quality Preferred Stock Index had returned 1.40% YTD, while the broader .  The high-quality index includes investment-grade constituents only, whereas 44% of the broader preferred index includes speculative-grade stocks and another 14% is not rated.  Similar to corporate bonds, preferred stocks are sensitive to changes in interest rates, however, also similar to equity, preferred stocks exhibit more volatility than most fixed income asset classes.

Along with portfolio diversification, preferred stocks can enhance overall yield.  Current yields, as of June 17, 2016, are almost three times higher than those of equities.

Exhibit 2: Multi-Asset Yield Comparison

Source: S&P Dow Jones Indices LLC. Data as of June 17, 2016. Chart is for provided for illustrative purposes. Past performance is no guarantee of future results.

According to Graham Day, the Senior Vice President at Elkhorn, “investment grade and cumulative preferreds have historically provided lower drawdowns compared with the broader preferred market.”[1]

Exhibit 3: Historic Drawdown Table

Source: S&P Dow Jones Indices LLC. Data as of April 30, 2016. The source of the data comes from the S&P/LSTA U.S. Leveraged Loan 100 Index, the S&P 500®, the S&P GSCI®, the S&P/BGCantor 7-10 Year U.S. Treasury Bond Index, the S&P U.S. Issued High Yield Corporate Bond Index, the S&P U.S. High Quality Preferred Stock Index, and the S&P U.S. Preferred Stock Index. Table is provided for illustrative purposes. Past performance is no guarantee of future results.

[1]   Bill Conboy, May 24, 2016, “Elkhorn Launches the First High Quality Preferred ETF (BATS: EPRF).”


The posts on this blog are opinions, not advice. Please read our Disclaimers.