Get Indexology® Blog updates via email.

In This List

Why the S&P 500 Reduces Portfolio Volatility for Indian Investors

Gold Breaks Out to a New All-Time High as the U.S. Dollar Drops

How Does Passive Investing Work in Uncertain Times?

What’s inside the S&P DJI Australian Factor Indices?

Getting Up to Speed with the Essentials of Index Construction

Why the S&P 500 Reduces Portfolio Volatility for Indian Investors

Contributor Image
Pratik Oswal

Head - Passive Funds

Motilal Oswal Asset Management Company

Home bias has been a prominent theme in India since the beginning of the mutual fund industry. Investors historically questioned why they should diversify their high GDP growth portfolio (India) with lower growth economies such as the US. This hypothesis has been tested over the last decade. India has delivered a high GDP growth but has fallen short in terms of profitability. The US has had the opposite effect. Despite low GDP growth, profitability has been better than any analyst would have predicted a decade ago.

Investors, as a result, have finally started to realize the importance of geographical diversification. It is a concept well accepted in developed parts of the world, such as the US and Europe, where most investors tend to have globally diversified portfolios.

So global investments have delivered good returns over long-term horizons. What else is there for Indian investors?

Low Correlation with Indian Equities

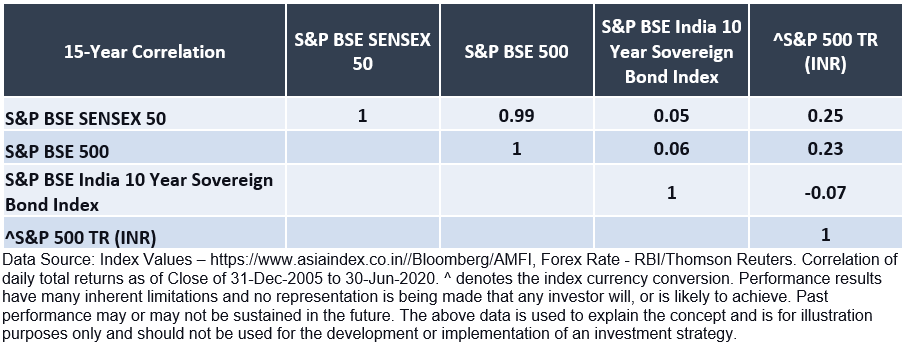
Commonly, investors have invested in multiple equity mutual funds with the hope of diversification. Historically, domestic mutual funds have tended to move in the same direction. Most Indian mutual funds have a correlation of 90%+, giving very little diversification to the investor. Investors in India who are looking to diversify their domestic portfolio tend to accept asset classes with traditionally lower yields such as debt, gold, and real estate.

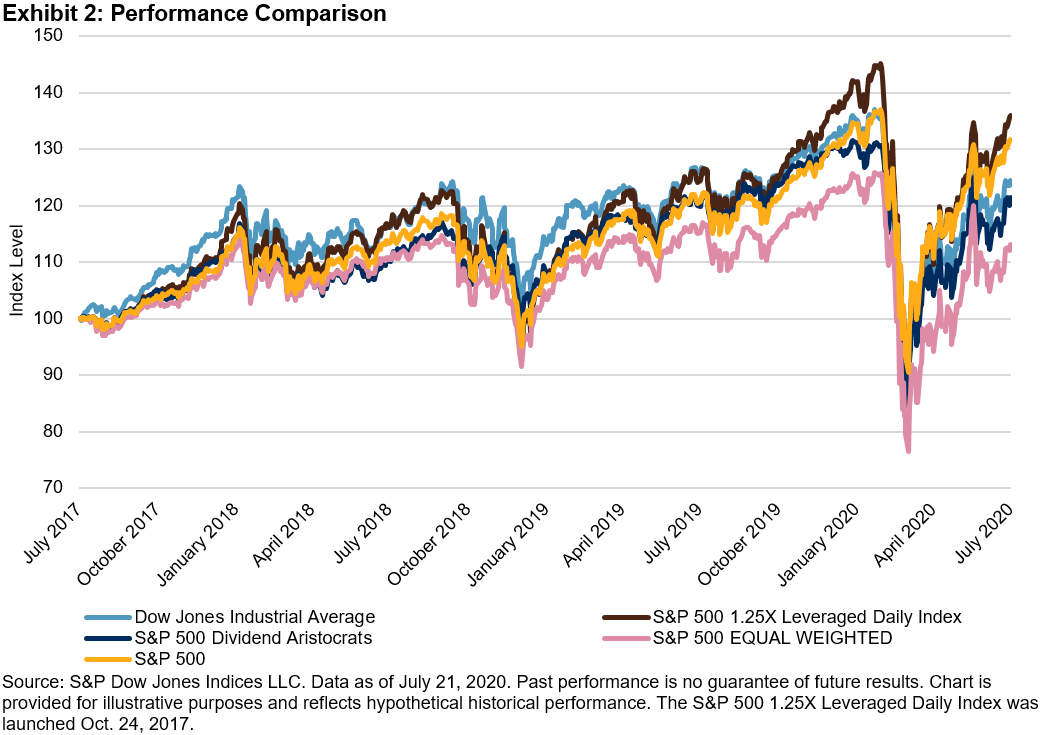
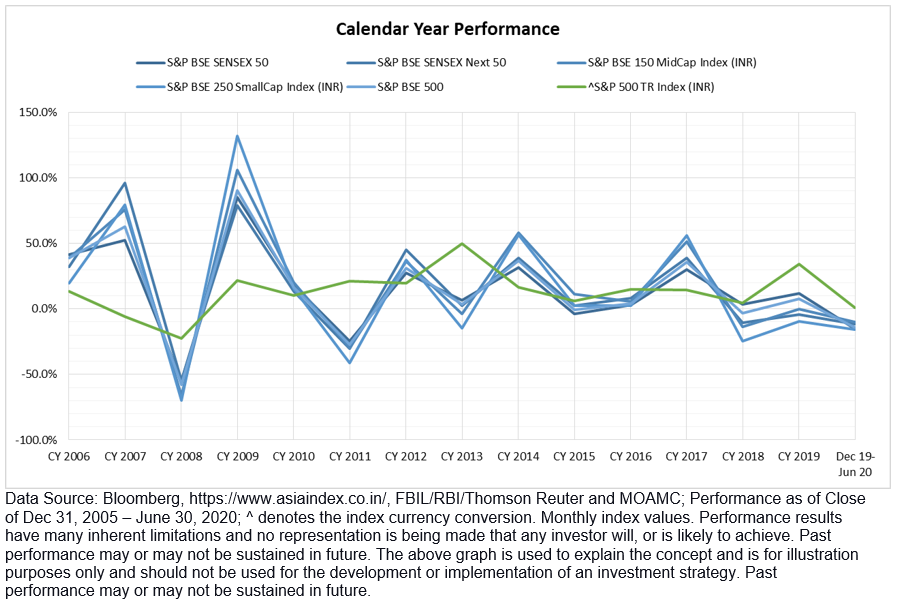
However, international equity is an asset class where investors have experienced equity-like returns and lower volatility due to diversification. The following chart shows calendar returns of the S&P 500 vs. broad-based index funds across categories.

With a lower correlation, investors have seen India and the US deliver good yield returns when combined with lower volatility.

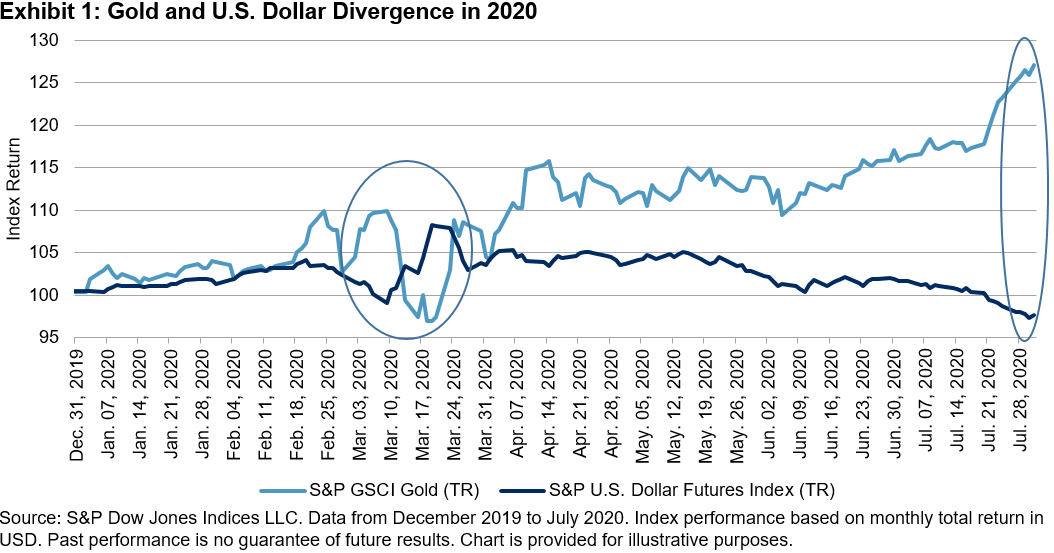
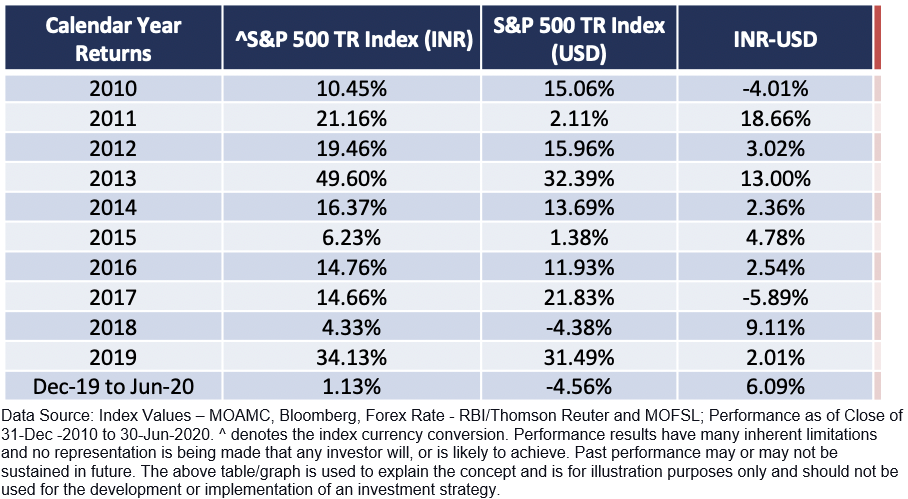
Currency as an Asset Class

The S&P 500 offers Indian investors two asset classes: US Stocks + USD as a currency. With the rupee falling most years (~5% CAGR) over the last ten years, international diversification can potentially give added protection over a falling currency. With investors increasing their spend in USD terms (foreign trips, education, electronics, etc.), it has become attractive to have some wealth invested in dollar-based assets such as the S&P 500.

Higher Dividends and Stock-Level Diversification 

The S&P 500 provides higher dividends in addition to sector-based diversification to Indian investors. India tends to be heavy on financial services, whereby the US tends to have a higher allocation towards Technology and Telecommunications. Access to some of the leading companies with globally diversified revenue streams adds well to the mix of stocks in an Indian investor’s portfolio.

In conclusion, international diversification has taken off partly due to high historical returns over the last decade and partly due to the disappointment in domestic markets. However, diversification is key when considering international investments.

The posts on this blog are opinions, not advice. Please read our Disclaimers.

Gold Breaks Out to a New All-Time High as the U.S. Dollar Drops

Contributor Image
Jim Wiederhold

Former Director, Commodities and Real Assets

S&P Dow Jones Indices

Despite the drop in volatility in many asset classes over the summer, some broke through key support and resistance levels.

The S&P GSCI Gold (TR) was one of them, reaching a new all-time high of USD 1,056.83 on Aug. 6, 2020, eclipsing the previous high from the summer of 2011. The underlying gold futures had reached new highs in several different major currencies over the past year, and they finally broke through in U.S. dollar terms.

Gold’s unprecedented rise is driven to a great extent by the bearish sentiment surrounding the U.S. dollar. Lower real rates and widespread fiscal and monetary stimulus measures have boosted demand for bullion, which is seen as a hedge against inflation and currency debasement. With many government bonds paying investors a negative return, the fact that gold is a financial asset that offers no income has become increasingly irrelevant.

Weakness in the U.S. dollar against a range of currencies is also supporting gold prices. The broad S&P U.S. Dollar Futures Index fell to a two-year low at the end of July 2020; in the eyes of some investors, gold is likely replacing the U.S. dollar as the ultimate safe currency. This break lower was a positive catalyst for gold to make new highs in the last week of July. Historically, there have been periods when the correlation between gold and the U.S. dollar was significantly negative. Current market conditions are ripe for the strength of negative correlation we are seeing in 2020 (see Exhibit 1).

Why is there such a strong negative correlation between gold and the U.S. dollar? The original use of gold was as a form of monetary exchange and store of value, just as the U.S. dollar is used today. The complementary nature of the two create an environment in which market participants tend to move from one to the other. When the U.S. dollar decreases, market participants look to other asset classes as alternative stores of value. Given that gold and most commodities are denominated in U.S. dollars, any depreciation in the dollar, by definition, increases the purchasing power of other currencies, potentially increasing the demand for commodities in those regions.

Faced with both an unprecedented shock and policy response, it remains unclear how inflationary the economic recovery will be, but inflation has certainly returned to the vocabulary of some investors. Gold is an inflation-sensitive asset. Inflation protection is a typical reason people look to commodities, and gold, to hedge their exposure. Over the long term, gold does not always move with inflation, but the two tend to be positively correlated (see Exhibit 2). Gold tends to be a better hedge than crude oil, especially during times of unexpected inflation. Over the past 40 years, the S&P GSCI Gold had a positively correlated performance to the U.S. CPI. Late business cycle environments tend to be a time for gold to shine—possibly more so than times of high inflation.

For more insight on gold, check out our previous blog that highlights why now is Gold’s Time to Shine. S&P DJI also released the first Spotlight on Commodities newsletter, containing relevant content for market participants looking to understand the performance of commodities this year.

The posts on this blog are opinions, not advice. Please read our Disclaimers.

How Does Passive Investing Work in Uncertain Times?

Many advisors feel that their favorite active manager will guide them through market volatility and limit drawdowns during times of market stress. But is that how things played out at the beginning of 2020? S&P DJI’s Brent Kopp and Berlinda Liu take a closer look at COVID-19’s impact on active vs. passive performance.

The posts on this blog are opinions, not advice. Please read our Disclaimers.

What’s inside the S&P DJI Australian Factor Indices?

Contributor Image
Liyu Zeng

Director, Global Research & Design

S&P Dow Jones Indices

In our paper, How Smart Beta Strategies Work in the Australian Market, our studies indicated that most factor indices in Australia exhibited distinct return characteristics during up and down markets. Indeed, different factor indices also displayed unique style and industry factor exposures, resulting in factor index performance differentials over the long term. In this blog, we examined the risk factor exposures, active risk, and excess return attribution for various S&P DJI Australian Factor Indices from Dec. 31, 2004, to May 29, 2020.

According to the factor exposure and return attribution table in Exhibit 1, the S&P/ASX 200 Momentum, S&P/ASX 200 Quality, and S&P/ASX 200 Low Volatility delivered better performance among various factor indices, mainly due to the high cumulative returns of their target style factors (momentum, profitability, and low volatility, respectively). All S&P DJI Australian Factor Indices had high exposures to their target style factors relative to the S&P/ASX 200, but unintended style factor exposures, industry biases, and stock-specific risk were also observed in various indices, and some of them had significant impacts on their excess returns. Return contribution from style factors was dominant for the S&P/ASX 200 Momentum and S&P/ASX 200 Quality, while the impact of stock-specific risks was pronounced in the S&P/ASX Small Ordinaries, S&P/ASX 200 Enhanced Value, and S&P/ASX Dividend Opportunities Index.

The S&P/ASX 200 Momentum attributed most of its outperformance to its target exposure to the momentum factor, while the impact of industry bias and stock-specific risk were minor. The outperformance of the S&P/ASX 200 Quality was mainly attributed to its target exposure to profitability and favorable industry biases, while its unintended tilts to small cap and momentum also attributed positively. Return attribution from the unexplained stock-specific risks was relatively insignificant.

The small-cap exposure attributed positively to the returns of the S&P/ASX Small Ordinaries, but the unintended exposures to high volatility, growth, and low profitability resulted in a significant negative return impact. Meanwhile, the target factors for the S&P/ASX 200 Enhanced Value and S&P/ASX Dividend Opportunities Index contributed negatively during the examined period, and the active exposures to low momentum and high volatility largely eroded the performance of these two indices. We also noticed that industry exposures and stock-specific risks posed significant negative impacts for the S&P Small Ordinaries, S&P/ASX 200 Enhanced Value, and S&P/ASX Dividend Opportunities Index.

For the S&P/ASX 200 Low Volatility, the target exposure was largely displayed as low market sensitivity (i.e., low beta), which generated significant excess returns for the index. Its small-cap bias also contributed positively, while its tilts to low momentum and high dividend yield, as well as unfavorable industry exposures, had a negative return impact. Different from what we saw from other Australian factor indices, stock-specific risk contributed favorably to the S&P/ASX 200 Low Volatility.

To understand the main sources of portfolio risks of the various factor indices, we decomposed the active risks of the S&P DJI Australian Factor Indices into different style risk factors, industry factors, and stock-specific risks. As shown in Exhibit 2, the risk composition was unique for different factor indices, and changed over time. Total risk attribution from style factors varied across a wide range for factor indices, from an average of 69.8% for the S&P/ASX Small Ordinaries to 30.5% and 27.2% for the S&P/ASX 200 Quality and S&P/ASX Dividend Opportunities Index, while total style factors accounted for 45.8%, 39.7%, and 38.7% of active risk for the S&P/ASX 200 Low Volatility, S&P/ASX 200 Momentum, and S&P/ASX 200 Enhanced Value, respectively.

Target style factors were key risk contributors for most factor indices, mainly due to high active exposures to the target factors. However, risks associated with unintended style factors, industry factors, and stock-specific risk were pronounced in some indices. For instance, the small-cap factor constituted a significant portion of active risk in most of the S&P DJI Australian Factor Indices over this period. On the other hand, industry factor risks were significant in the S&P/ASX 200 Low Volatility, S&P/ASX 200 Quality, and S&P/ASX Dividend Opportunities Index, accounting for 39.3%, 34.0%, and 30.4%, on average, of their total active risks, while stock-specific risks attributed to 42.3%, 36.7%, and 35.5% of the total active risks in the S&P/ASX Dividend Opportunities Index, S&P/ASX 200 Value, and S&P/ASX 200 Quality, respectively.

As we can see from this risk/return attribution analysis, various factor portfolios had distinct factor exposures that drove performance differently. Decomposing the source of active returns and risks helps explain the behavior of factor portfolios in different market environments, especially for those with high risk/return attributions from unintended style factors and industry factors.

The posts on this blog are opinions, not advice. Please read our Disclaimers.

Getting Up to Speed with the Essentials of Index Construction

Contributor Image
Koel Ghosh

Former Head of South Asia

S&P Dow Jones Indices

Why choose index investing? Yes, the merits of diversification and low cost are usually factored in, though one critical benefit that many do not realize is the transparency that is provided in the methodology of an independent index provider. To understand what goes into the design and methodology of an index, it’s important to note that it’s not a random pick of securities to represent the index’s concept or design. So, let’s skim through some basics of index construction.

Indices offer a wide range of options whereby their calculation methods might vary. Most equity indices are market-cap weighted and float adjusted, where each stock’s weight in the index is proportional to its float-adjusted market value. Some equity indices are price-weighted indices, in which constituent weights are determined solely by the prices of the constituent stocks in the index. An example would be the Dow Jones Industrial Average®. Then there are equal-weighted indices in which each stock is weighted equally in the index. There can be restrictions placed in the index where certain constituents are assigned a minimum or maximum weight, and this can be applied to sectors as well. A few more to add to the variety are options include leveraged and inverse indices, which return positive or negative multiples of their respective underlying indices, dividend indices, which track the total dividend payments of index constituents, and the list goes on.

A common query among many is how exactly is an index calculated? Is it a simple average, or is there some complex formula that runs that magic number? The key concept to understand index calculation would be the index divisor. In a capitalization-weighted index, wherein the portfolio consists of all available shares of the stocks in the index, the total value will be a large number (e.g., the float-adjusted market value for the S&P 500® is a figure in the trillions of U.S. dollars). Hence, to make it easy, the number is scaled down by dividing the portfolio market value by a factor, usually called the divisor.

An index does not behave like a portfolio, as a stock that is added to or deleted from an index would not result in the index level changing, in contrast to a portfolio’s value that would usually change to reflect movements in its holdings. To ensure that the index’s value, or level, does not change when stocks are added or deleted, the divisor is adjusted to offset the change in the market value of the index. Thus, the divisor plays a critical role in the index’s ability to provide a continuous measure of market valuation when faced with changes to the stocks included in the index. In a similar manner, some corporate actions that cause changes in the market value of the stocks in an index should not be reflected in the index level. Adjustments are made to the divisor to eliminate the impact of these corporate actions. There is a large range of different corporate actions, from routine share issuances or buybacks to less-frequent events such as spin-offs or mergers. The index provider details the impact of such corporate actions in their methodology document. The application of changes depends on the type of index and the need for the adjustment with respect to the announced corporate action.

Furthermore, index providers list the rebalancing schedule of the index so that the index is consistent with the methodology.

Index providers do not create the passive products, and hence there is complete independence and a lack of bias to the passive product offered by a product provider. For the product provider as well, they can impress upon the neutrality of the product, as the underlying design is based upon the index provider’s methodology.

Exhibits 1 and 2 provide a sample of different index types and their trends.

The posts on this blog are opinions, not advice. Please read our Disclaimers.