Get Indexology® Blog updates via email.

In This List

Why The S&P 500® Matters in India

From COVID-19 to U.S.-China Tensions, What to Expect Next for Chinese Equities

IRONclad ORE Is Full of Steam

Introducing the Dow Jones Equity All REIT Capped Index

2020 – The Dawn of the Passive Investing Era in India: Part One

Why The S&P 500® Matters in India

Contributor Image
Hamish Preston

Head of U.S. Equities

S&P Dow Jones Indices

We recently held a webinar examining the relevance of the S&P 500 to India-based investors, the potential diversification benefits of incorporating U.S equity exposure to an existing allocation, as well as showing how difficult active managers have found it to beat the index, historically.  You can watch a replay of the webinar here; here are a few highlights.

Having a U.S. view is important for investors around the world.

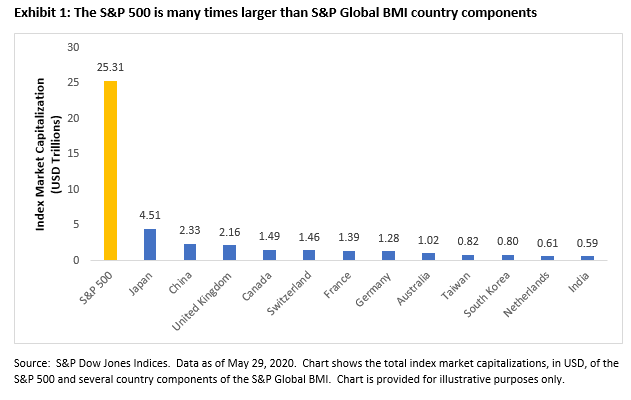
As we have highlighted before, having a U.S. view is vital in a global equity portfolio context.  U.S. companies account for a significant proportion of the global equity market capitalization, therefore trends impacting these companies will be relatively important in driving global equity returns.  For example, the total market capitalization of S&P 500 companies is many multiples larger than other country components of the S&P Global BMI, our global equity benchmark.

Combined with the fact that the S&P 500 accounts for over 80% of the U.S. market, it is perhaps unsurprising that so many people turn to the index to gauge U.S. market performance.  Indeed, our latest Survey of Indexed Assets shows that over USD 11.2 trillion was indexed or benchmarked to the S&P 500 at the end of 2019.

The S&P 500 can help to diversify domestic sector biases.

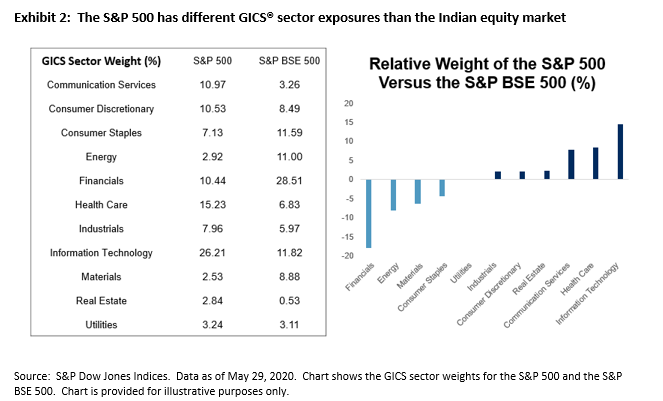
For exposure to certain sectors, Indian investors may find it beneficial to turn to the U.S. – S&P 500 companies accounted for most of index market capitalization in the S&P Global BMI Information Technology, Health Care and Communication Services sectors at the end of May.  Such sizeable representation helps to explain why the S&P 500 has higher weights in these market segments compared to the Indian equity market, as represented by the S&P BSE 500 index.  More broadly, differences in sector breakdowns in the two indices illustrate how the S&P 500 can help to diversify the Indian equity market’s sector biases.

Active managers have struggled to beat the S&P 500, historically.

An important choice for investors is whether to take an index-based approach or to employ an active manager to try and outperform the market. While this debate seems to be evergreen – there are ardent supporters on both sides – S&P Dow Jones Indices publishes semi-annual SPIVA® scorecards to inform the debate.  In particular, SPIVA scorecards compare the performance of active managers against their S&P index benchmarks across multiple regions.

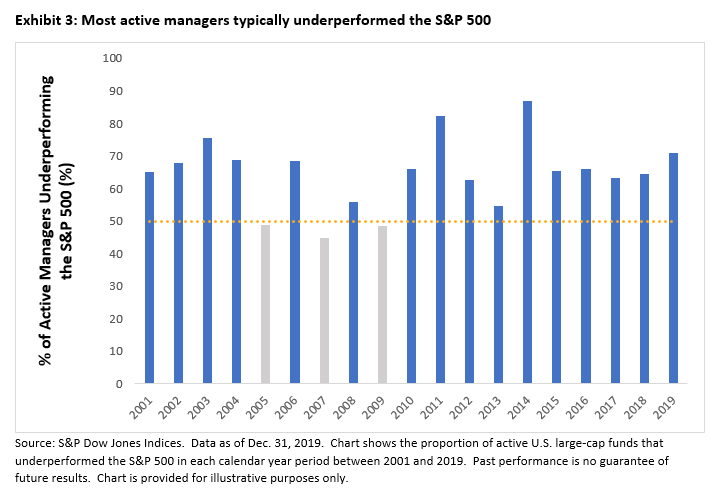
Exhibit 3 shows the majority of large-cap U.S. active managers typically underperformed the S&P 500 since 2001:  the majority of funds underperformed in 16 of the last 19 calendar year periods.  Given this underperformance is frequently observed on a risk-adjusted basis and the start of 2020 offered active managers no place to hide, many may wish to consider the potential benefits of taking an index-based approach.

To sign up for S&P Dow Jones Indices’ scorecards and market commentary, use this link.

The posts on this blog are opinions, not advice. Please read our Disclaimers.

From COVID-19 to U.S.-China Tensions, What to Expect Next for Chinese Equities

Contributor Image
Priscilla Luk

Managing Director, Global Research & Design, APAC

S&P Dow Jones Indices

On May 29, 2020, I joined S&P Global’s The Essential Podcast, “A View to the Future – China Beyond the Pandemic,” to discuss the Chinese equity market’s performance and the macroeconomic trends during and beyond the COVID-19 pandemic. This blog includes some key highlights we discussed, along with the related index performance observed in the Chinese equity market.

As mentioned in our previous blog, “How the Chinese Equity Market Responded to the Domestic and Global Coronavirus Outbreak,” the China A-shares market experienced a substantial drawdown, with significant industry return spreads during the early and middle stages of the COVID-19 pandemic in China. The Health Care sector performed the best, while consumer-based constituents such as airlines and hotels lagged the most.

However, as China is a non-oil-exporting country with minimized exposure to falling oil price and the Chinese renminbi has remained largely stable relative to other emerging market currencies, Chinese equities have experienced lower volatility and have become an unexpected stabilizing force for emerging markets (see “An Unlikely Stabilizer in Emerging Markets” for more details). Year-to-date, the S&P Total China Domestic BMI outperformed the S&P Emerging ex-China BMI by 21.4% in USD terms.

Companies engaging in internet business and technologies that provide contactless services performed relatively well during the pandemic. Due to the lockdown, the time people spend working from home, online shopping, and viewing social media and online entertainment has significantly increased. This resulted in a shift in business and consumer behavior, and this trend has continued even post-lockdown.

During to the COVID-19 crisis, rising tensions between the U.S. and China were seen with continuous investment restrictions, export controls, tariffs, and policies to slow the pace of technology transfer to China. As pointed out in “A Great New Game—China, the U.S. and Technology,” published by S&P Global’s China Senior Analyst Group last year, the focus of U.S. trade and investment policies has turned to technology more than shrinking the bilateral trade deficit. In response to that, Chinese onshore technology stocks tended to suffer more than the overall market shortly after news related to U.S.-China friction.

If friction between the U.S. and China continues to persist, foreign companies may reduce their supply chain reliance on China, and the slowing pace of technology transfer from foreign countries in the production process in China may also hurt China-based companies’ competitiveness over time. However, S&P Global Rating’s recent comment, “Decamping Factories Unlikely To Unplug China’s Growth Advantage,” suggested many foreign manufacturers are also likely to continue investing in China due to the fast-growing domestic market. Equity prices seemed to align with this view, as we did not see significant underperformance in Technology Hardware stocks and saw outperformance in Semiconductors stocks in China since the beginning of this year.

References:

The Essential Podcast, Episode 11: A View to the Future – China Beyond the Pandemic, Priscilla Luk and Nathan Hunt, S&P Global (May 29, 2020)

How the Chinese Equity Market Responded to the Domestic and Global Coronavirus Outbreak, Priscilla Luk, S&P Dow Jones Indices (April 5, 2020)

An Unlikely Stabilizer in Emerging Markets, John Welling, S&P Dow Jones Indices (Apr 3, 2020)

A Great New Game—China, the U.S. and Technology, The China Senior Analyst Group, S&P Global (May 14, 2019)

Decamping Factories Unlikely To Unplug China’s Growth Advantage, KimEng Tan & Rain Yin, S&P Global Ratings (May 21, 2020)

The posts on this blog are opinions, not advice. Please read our Disclaimers.

IRONclad ORE Is Full of Steam

Contributor Image
Jim Wiederhold

Former Director, Commodities and Real Assets

S&P Dow Jones Indices

Just like the ironclad battleships of the 19th century, the S&P GSCI Iron Ore has steamed through 2020 in the explosive sea battle atmosphere of this year’s highly volatile markets. It stayed afloat when most commodities sunk to negative YTD returns (see Exhibit 1).

The S&P GSCI Iron Ore was up 22.1% YTD as of June 12, 2020. Launched Nov. 26, 2018, and based on the SGX futures, this index was timely in its creation due to the significant growth in the iron ore market. Similar to gold with its many positive catalysts, iron ore has a lot going for it in 2020. My first blog post from one year ago highlighted the fundamental reasons behind the strong iron ore price at the time. In its first full year of life as an index, the S&P GSCI Iron Ore rose 82% in 2019, hitting several new highs. It set a new all-time high in 2020 one month ago on May 18.

This year, another issue has cropped up to affect the supply picture—market concerns in the form of Brazilian mine shutdowns due to COVID-19. Brazil is the second-largest exporter of iron ore behind Australia (see Exhibit 2). China is the top importer, and no other country comes close to its 62% global share. New COVID-19 cases in Brazil are still escalating, making it a hot spot for the pandemic. This may also affect other major commodities’ production, such as soybeans, of which Brazil is the top exporter.

For such a historically volatile commodity, this year iron ore has displayed less volatility than Brent crude and all other major energy commodities, yet it was more volatile than other industrial type metals. While launched Nov. 26, 2018, the S&P GSCI Iron Ore has a first value date of May 7, 2013, giving us seven years of back-tested performance. Exhibit 3 highlights the volatility of the S&P GSCI Iron Ore and other select commodities.

For a more in-depth look at the financialization of the iron ore market, check out the recent collaborative paper from S&P Global Platts and S&P Dow Jones Indices here. Single commodities, whether iron ore, gold, or soybeans, can be useful to investors looking to express investment themes that are dependent on unique geopolitical, demographic, structural, climate, and even health and disease factors.


The posts on this blog are opinions, not advice. Please read our Disclaimers.

Introducing the Dow Jones Equity All REIT Capped Index

Contributor Image
Rachel Du

Senior Analyst, Global Research & Design

S&P Dow Jones Indices

On April 13, 2020, the Dow Jones REIT Index Series welcomed a new index—the Dow Jones Equity All REIT Capped Index. The strategy is a subindex of the Dow Jones Equity All REIT Index, which was launched in January 1997. Although both indices were designed to measure the performance of all publicly traded REITs, the newly launched Dow Jones Equity All REIT Capped Index has some unique features.

The Dow Jones Equity All REIT Capped Index seeks to represent the largest and most liquid REITs. To be eligible for inclusion in the index, a REIT company must have a minimum float market capitalization (FMC) of USD 200 million. An existing constituent becomes ineligible if its FMC falls below USD 100 million for two consecutive quarters. In addition, all index constituents must have a median daily value traded (MDVT) of at least USD 5 million over the prior three months. The MDVT for any existing constituents is USD 2.5 million.

The additional market cap and liquidity criteria can potentially improve the tradability of the index. Exhibit 1 and 2 compare the FMC and MDVT[1] between the Dow Jones Equity All REIT Index and the Dow Jones Equity All REIT Capped Index. Over the past five years, the size and liquidity of the Dow Jones Equity All REIT Capped Index were higher by about 30% over its benchmark index.

The multiple capping rules historically helped the Dow Jones Equity All REIT Capped Index reduce concentration and improve diversification. At each rebalancing, the weight of an index member is capped at 10%, and all constituents that have a weight greater than 4.5% in aggregate are limited at 22.5% of the index. Exhibit 3 shows the weight comparison as of May 29, 2020. The total weight of all constituents with a weight above 4.5% in the Dow Jones Equity All REIT Capped Index is 8.29% less than that of the uncapped version.

With improved tradability and diversification, the index has had a comparable performance with the Dow Jones Equity All REIT Index. Exhibit 4 illustrates that the performance of the Dow Jones Equity All REIT Capped Index is not compromised by the additional rules for size, liquidity, and diversification. While the index outperformed over the short term (one- and three-year periods), both indices had similar absolute and risk-adjusted returns over the long term (since the Dow Jones Equity All REIT Capped Index’s inception date of March 19, 2010).

[1] The FMC and MDTV data is calculated as follows: At each quarterly rebalancing, the median values of the FMC and MDTV are calculated. The average of the median values for each year are used for comparison.

The posts on this blog are opinions, not advice. Please read our Disclaimers.

2020 – The Dawn of the Passive Investing Era in India: Part One

Contributor Image
Koel Ghosh

Former Head of South Asia

S&P Dow Jones Indices

The year 2020 has brought about many unexpected turns of events. The COVID-19 pandemic, which will be marked in history as one of the most-acute pandemics that the world has had to experience, is one.

Another area that has seen a transformation in the financial investing space is the realization and acceptance of passive investing. The recent growth trends globally and in India are marking new trajectories. The global growth story in passive products has been strong and broadening, with new innovations and themes. India has played catch-up, with the exponential growth in assets in the past few years revealing the potential for the passive space in the region.

As of March 2020, global assets in passive products passed USD 5 trillion, with over 7,000 passive products. The U.S., with a market share of 68%, USD 3.6 trillion in assets, and over 2,000 products, is followed by Europe and Japan with 16% and 6.5% of market share, respectively. The global asset mix is skewed toward equities, leading with a 70% share in assets at USD 3 trillion, followed by fixed income with a 21% share at USD 1 trillion.

For India, though the numbers are far more modest, the growth has been encouraging, with the total assets under management in passive products at USD 24 billion and 86 passive products. Five years ago, the scenario in India included a mere USD 2 billion in assets and 57 products. A decade back had far less, with USD 1 billion and 26 products in the market. Hence, the progress made by the country has been remarkable, especially in the backdrop of a faster-paced active investing market. Two years ago, the exchange-traded fund market constituted 2.2% of the mutual fund industry, while in December 2019, it stood at 7.5%.[1]

Global themes in passive products have progressed from plain vanilla asset classes, geographies, segments, and market benchmarks to factors that could be single or multi-factor, thematic-like infrastructure or corporate clusters, sustainability (a popular and fast-growing segment), and so on. Furthermore, advanced concepts are being explored via indices, such as new economies. For example, the S&P Kensho New Economies Indices are a family of indices tracking the industries and innovations of the Fourth Industrial Revolution.

Rapid developments in artificial intelligence and robotics, coupled with exponential processing power and ubiquitous connectivity, are driving structural changes in the global economy, disrupting existing industries and forging new ones. The S&P Kensho New Economies Composite Index is designed to measure the performance of companies involved in the New Economies 21st Century Sectors, including a dynamically adjusted list of companies drawn from all of the S&P Kensho New Economy subsector indices. The S&P Kensho New Economies Select Index measures a subset of the five best-performing subsector indices.

These new innovative indices are breaking grounds in investment themes and products that offer further variety to portfolio strategies.

[1] Source: https://etfgi.com. March 2020.

The posts on this blog are opinions, not advice. Please read our Disclaimers.