After the S&P 500 logged its 9th worst Oct. on record, losing 6.9%, it has bounced back 2.6% month-to-date through Nov. 9, 2018. Though the monthly returns for the eight Novembers following the historically bad Octobers were only positive twice – in 1978 (President Jimmy Carter midterm year) and 1933 – the fact there was a midterm election this year may help the chance of a solid rally if history repeats itself. Historically, the S&P 500 has been positive in most periods after the midterm elections.
In the months of Nov. and Dec. during historical midterm election years, the S&P 500 gained 14 of 22 times in Nov. and in 15 of 22 times in Dec. with a combined 2-month gain in 17 of the 22 midterm election year-ends. In percentage terms, the S&P 500 gained in 64% of midterm election Nov. months and 68% of the following month that when combined into a 2-month return resulted in gains 77% of the time. Also, the magnitude of the average gains in the 2-month period was 6.1%, more than the magnitude of the average loss of 4.1%.
In longer time periods, over 6-, 12-, and 24-months post historical midterm election years, the S&P 500 fell just 3 times in the 6-month and 24-month periods and only twice in the 12-month periods. The two negative 12-month periods followed the midterm elections in 1930 (President Herbert Hoover) and 1938 (President Franklin D. Roosevelt) with respective losses of 37.8% and 2.6%. Interestingly, President Herbert Hoover was also Republican with a split Congress post midterm election in 1930. (President Ronald Reagan in 1982 was the only other Republican with a split Congress post midterm election besides President William Taft in 1910, before the S&P 500 was calculated.) Since the midterm election of 1942, there have been 19 consecutively positive 12-month post midterm election period gains. In the shorter and longer post midterm election periods of 6- and 24-months, two of the three losses were also in 1930 and 1938. In the 6-month period after the midterm elections in 1930 and 1938, the S&P 500 lost a respective 10.9% and 17.1%. The additional 6-month post midterm election loss of 1.8% happened in 1946 (President Harry S. Truman). Finally, the three losing 24-month periods following the midterm elections were in 1930, 1938 and 2008 (President Barack Obama) with respective losses of 58.9%, 15.9% and 29.7%.

When expanding this analysis across sizes, sectors and styles, the data is more limited by its history back to 1990 so only covers seven prior midterm elections during the presidential terms of George H. W. Bush (Republican, 1990,) Bill Clinton (Democrat, 1994, 1998,) George W. Bush (Republican, 2002, 2006,) and Barack Obama (Democrat, 2010, 2014.) As noted, there were 4 Democrat and 3 Republican terms. Five of the seven had a united Congress that was opposite the presidential party, the 2002 period was completely Republican, and the 2010 period under President Obama had a Republican House and Democrat Senate after the midterm election.
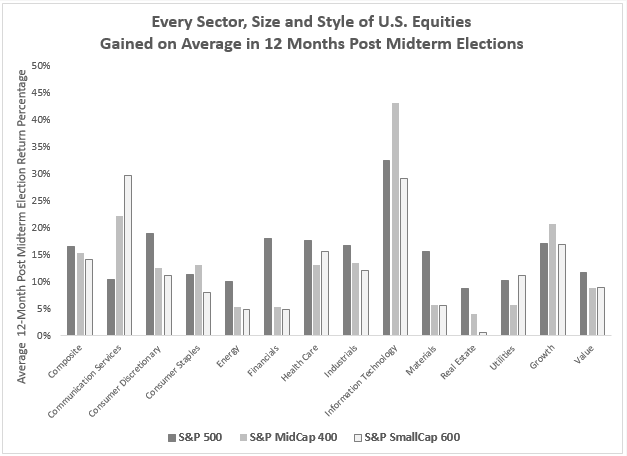
Irrespective of parties, all U.S. equities have done well in post midterm election periods. On average, in the 12-months following midterm elections every size, sector and style of the U.S. equity market was positive. Large caps performed best, gaining on average 16.6%, but the S&P MidCap 400 and S&P SmallCap 600 gained also a respective 15.4% and 14.1%. Information technology was the best performing sector gaining on average, 32.5%, 43.3% and 29.1%, respectively, in large-, mid- and small-caps. Also, noteworthy is the outperformance of large- over small-caps in financials and materials on average in the 12-months post midterm elections, which is interesting given the interest rate sensitivity of financials and the influence of international trade on materials. Lastly, growth has outperformed value, and more significantly in mid- and small-caps than in large caps with average 12-month post midterm election returns of 17.2%, 20.9% and 17.0%, respectively in large-, mid- and small-cap growth, that were greater than the gains of 11.7%, 9.0% and 8.9% in value from large-, mid- and small-caps, respectively.

The only exceptions to the strong U.S. equity performance in the post midterm election periods came from energy in the mid- and small-caps during the months of Nov. and Dec., which is not surprising given the seasonality that pushes oil prices down in the the fourth quarter from reduced gasoline demand and refinery maintenance post the driving season. Nov. is the worst month on average in the S&P GSCI Crude Oil index with losses of 2.9% since 1987. However, since the large companies typically hedge against falling oil prices, they are more insulated from the oil price drops.
Not only have U.S. equities performed well on average in post midterm election periods, but now, with the split Congress, the potential gridlock on legislation may possibly benefit international stocks too. If growth slows and inflation is weaker – pressured by falling oil, it is possible the Fed may moderate interest rate hikes that in-turn could limit the US dollar rise. Also, if the trading tensions between China and US could ease, that might be helpful for the global markets.