Get Indexology® Blog updates via email.

In This List

Three Myths of the U.S. Senior Loan Market

Building the Hope for Change

3 Reasons Putin's Nat Gas Deal Is A Big Deal

Market Reflects Negative Outlook for Homebuilding In 2014

Hedge Funds Agonistes

Three Myths of the U.S. Senior Loan Market

Contributor Image
J.R. Rieger

Former Head of Fixed Income Indices

S&P Dow Jones Indices

The S&P/LSTA U.S. Leveraged Loan 100 Index has returned 1.76% year to date under performing vs. fixed rate high yield bonds.  The low rate environment and continued demand for yield generating asset classes has pushed the S&P U.S. Issued High Yield Corporate Bond Index returns to  4.32% year to date as yields have fallen by 38bps since year end.

Three myths of the U.S. senior loan market:

Myth 1: Senior loans are more volatile than high yield bonds:  the data just does not support this statement.

The five year standard deviation of index level changes (as of quarter end March 31, 2014):

  • S&P/LSTA U.S. Leveraged Loan 100 Index:  7.28%
  • S&P U.S. Issued High Yield Corporate Bond Index: 8.27%

Biggest index drop:

  • S&P/LSTA U.S. Leveraged Loan 100 Index:  -27.9% Dec 2008
  • S&P U.S. Issued High Yield Corporate Bond Index: -30.4% Nov 2008

(In Feb 2009, the S&P 500 was down over 46% and the S&P GSCI was down over 67%)

Myth 2: Interest rate floors built into many floating rate loans are a negative attribute of these loans: Senior loans are floating rate.  As rates rise, the interest rates these loans pay eventually rises.  Currently, approximately 80% of the loans in the S&P/LSTA U.S. Leveraged Loan 100 Index have interest rate floors that have protected buyers from the current extremely low rate environment.  As rates rise above those floors, the loans can be expected to pay even higher interest rates.  Meanwhile, lenders are getting higher rates due to these floors than had the floors not been in place. Prices of fixed rate bonds of course fall as bond yields rise.

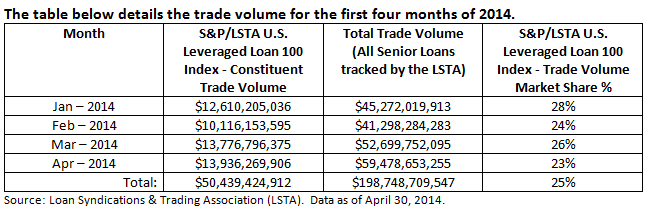
Myth 3: The liquidity of the loan market is nonexistent:  During the first four months of 2014 over $198billion of senior loans have traded in the secondary market.  The 100 constituents of the S&P/LSTA U.S. Leveraged Loan 100 Index represented 25% of the trade volume (over $50billion). The Index is designed to track the most liquid of these senior loans and results in tracking over $237billion of loans by market value.LoantradevolumeApril2014

The posts on this blog are opinions, not advice. Please read our Disclaimers.

Building the Hope for Change

Contributor Image
Koel Ghosh

Former Head of South Asia

S&P Dow Jones Indices

Last week India witnessed a historic event at the declaration of its 16th Lok Sabha election results. After a span of over 30 years has there been such a majority mandate handed out by the Indian voters who confirmed their need for change.

Equity Markets
The Indian equity market investors greeted the news favourably with the S&P BSE SENSEX crossing the 25000 mark for the first time in the history of Indian stock markets and further recorded as the third-best performer in Asia in dollar terms. To put it more plainly, the S&P BSE SENSEX has had a return of 15% in just the past 5 ½ months, since the start of this year.

Expectations
Eminent leaders of their field, reputed professionals, and renowned market experts have expressed their recommendation on the areas of reforms. Some of the key expectations are lower Inflation, strengthening of the rupee, improving overall growth rates, lowering of the unemployment rate, revival of the investment scenario and a common wish list among many, a boost to infrastructure.

Government Direction
The Government of India, Planning Commission in its Twelfth Five Year Plan (2012–2017) estimated the total investment in infrastructure sectors to be approximately one trillion dollars. The plan outlines new projects and development in airports with three new airports namely Navi Mumbai, Goa and Kannur. Additionally two ports in West Bengal and Andhra Pradesh. Development in railways to build out the Western and Eastern Freight Corridor, the Mumbai Elevated Rail Corridor and the High Speed Corridor. Roads also form an integral part of the developmental plan along with expansion in power and telecommunication.

Given the gamut of plan, funding of these infrastructure projects is critical. There is an expectation of a contribution of nearly 48% by the private sector. A funding gap is already projected in the plan and this is where the scope for inviting investments in this space broadens to provide the necessary boost.

Value Unlocking
Infrastructure can be the catalyst to provide the necessary boost to many sectors that can cumulatively contribute to economic and overall growth for the country. For those who want to avoid timing the markets or lack stock specific insights, index investing enables exposure to the sector and related returns via a rules based approach provided by an independent index provider.

While the euphoria of the elections is now settling down, May 26, 2014 brings in the swearing in of a new Prime Minister and a new government to realize the hope of a change … a change for a better India…” Acche Din Ayenge”( Good days are here to come)


The posts on this blog are opinions, not advice. Please read our Disclaimers.

3 Reasons Putin's Nat Gas Deal Is A Big Deal

Contributor Image
Jodie Gunzberg

Former Managing Director, Head of U.S. Equities

S&P Dow Jones Indices

It’s not just because it took 10 years to negotiate with China or is worth $400 billion, but the new deal Gazprom signed to supply 38 billion cubic meters (bcm), which is about the amount NY state uses annually, of natural gas to China each year for the next 30 years may be a major game changer for 3 big reasons.

The first big reason is that this deal may reduce air pollution in China.  That may not only clean the air for breathing but may reduce the erratic weather causing global warming that is spiking agriculture prices  and now possibly food prices.  Since the deal implicitly prices the natural gas China is receiving from Russia at a 25% to 40% discount to the cost of importing liquefied natural gas from overseas, this may not only cause China to use this gas over the rest of the world’s but it may motivate China to more actively replace oil and coal with natural gas as main energy sources. Given natural gas is cleaner, this in turn may reduce pollution. 

The second reason this deal is a big deal is that it may be the catalyst to building natural gas from a local commodity to a global commodity.  If natural gas becomes more standardized and tradable as a global commodity, it may not only reduce pollution by motivating the switch from oil and coal, but it may include specifications within the contracts to set forth guidelines to control pollution. Currently natural gas is the only commodity in the S&P GSCI where the World Production Quantity is determined based on regional (North American) production.  The globalization largely depends on the logistics and technology in order to transport the gas. For example, in 2013 there was news of a U.K. company signing a deal to bring U.S. natural gas to U.K. homes, which may help the U.S. natural gas globalization, but the trick is having the infrastructure in place to execute the trade.  

Last, this deal may open investment opportunities across the energy spectrum. The construction of the pipeline may initially create some direct investment opportunities but as the pipelines start working, it may possibly further open futures markets, at least regionally if not globally, to encourage more production that may grow the entire market.


The posts on this blog are opinions, not advice. Please read our Disclaimers.

Market Reflects Negative Outlook for Homebuilding In 2014

Contributor Image
Tyler Cling

Senior Manager, Fixed Income Indices

S&P Dow Jones Indices

The U.S. Department of Commerce released data last Friday showing that housing starts in April were up 26.4% from April of last year and 13.2% since March. In a vacuum, you would expect that the market would look favorably on the homebuilder’s market when the amount of homes being built is increasing.

Capture

The home building market however continues to underperform as a sector in 2014. YTD the S&P Homebuilders Select Industry Index (TR) (which benchmarks homebuilding, buildings products, home furnishings, home improvement, retail home furnishings, and household appliances) is down -7.86%. Estranged from overall market benchmarks like the S&P 500(TR), which is up 2.14% on the year. Homebuilder returns are even more dismal when compared to leading sectors such as energy exploration and production, as indicated by the S&P Oil & Gas Exploration & Production Select Industry Index (TR) which is up 8.41% YTD.

Capture

 A more telling story is the market’s perception of elevated risk regarding the homebuilder’s market moving forward. Market wide credit default swap spreads for the largest investment grade and high yield issuers have continued to tighten in 2014. This is illustrated by the S&P/ISDA U.S 150 Credit Spread Index which has seen highs of over 91bps in January drop down to 51 bps in 2014. Lower spreads indicate market participants are willing to accept lower risk premiums to “insure” the underlying entities.

Capture

Credit default spreads in the housing sector have been widening however, up 21 bps in 2014 to 168 bps. Translated, default insurance on a credit with a notional amount of $100,000 would cost $1,689 or 14% more than it did in January. Energy CDS spreads while trading more closely in price to homebuilders have also fallen in 2014 (S&P/ISDA CDS U.S. Energy Select 10: -7 bps).

Capture

The homebuilders’ market sector that was once catalyst to driving the U.S. economy with the wide breathe of industries whom benefitted from its success, is underperforming and viewed as increasingly risky compared to its peers, even in lieu of positive growth.

Capture

NOTE: One should be mindful to differentiate the homebuilders market from the overall housing market (which can be tracked using S&P/Case-Shiller National Home Price Index).


The posts on this blog are opinions, not advice. Please read our Disclaimers.

Hedge Funds Agonistes

Contributor Image
Tim Edwards

Managing Director, Index Investment Strategy

S&P Dow Jones Indices

 “A lot of people were hoping this year would turn out to be a stockpickers’ market, but that has turned out to be anything but the case so far” – Troy Gayeski, partner and senior portfolio manager at SkyBridge.

At the beginning of this year, we indicated that despite a chorus of voices to the contrary, 2014 would not prove to be a “stock-picker’s market”. We also speculated that 2014 might well be the first year in which ETF assets overtake those in hedge funds.

The first prediction was based on the observation that dispersion – a measure of the opportunity set for active management – was at record lows. Combined with dispersion’s historical tendency to change fairly slowly, we anticipated that dispersion would remain low for some time. So far in 2014, it has done:

2014 YTD 500 Dispersion

Source: S&P Dow Jones Indices as of month-end April 2014. Charts provided for illustrative purposes. Past performance is no guarantee of future results.

There are two ways a fund (ETF or otherwise) can gain assets: it can attract new money, or gain new assets through positive returns. Even if hedge funds don’t perform, they may still attract assets; it certainly seems that they have been doing so. On the other hand, the record quarterly flows into hedge funds last quarter were outpaced by assets attracted to ETFs in April alone.

And what of the “stock-pickers” performance? According to today’s Financial Times, so far not so good.

The race is most certainly on…

The posts on this blog are opinions, not advice. Please read our Disclaimers.