Get Indexology® Blog updates via email.

In This List

Voting with Their Feet

Getting Grim For Gold Miners?

Looking Back To Look Ahead

Easing the Fed's Worries Over Quantitative Easing

Everyone Complains About the Weather

Voting with Their Feet

Contributor Image
Tim Edwards

Managing Director, Index Investment Strategy

S&P Dow Jones Indices

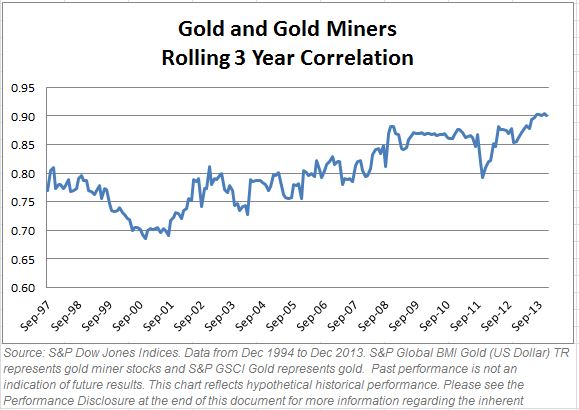
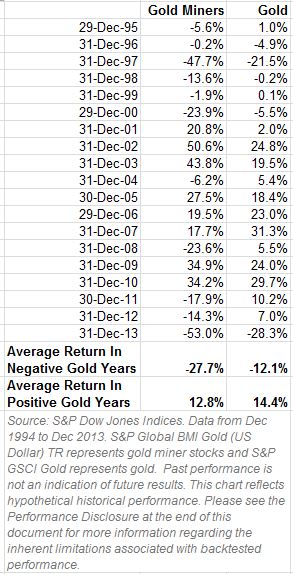
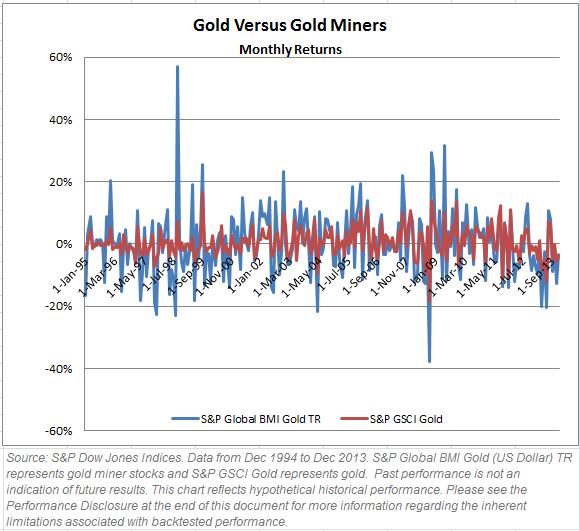
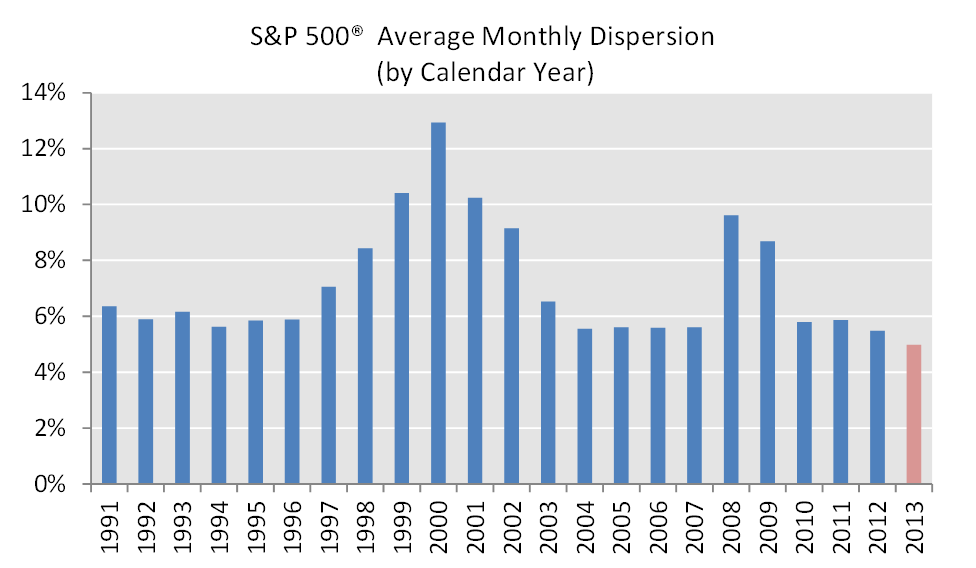
Despite superb returns for the equity markets across the developed world, 2013 was a tough year for active managers.  While the average hedge fund recorded fairly solid gains over the year, such performance paled in comparison to the rampant equity markets.  It was also a year that saw historic lows for the potential returns available from the expert selection of securities.  By some measures, it was the toughest year for stock pickers in decades: rarely in history did the average stock deviate so little from its peers, or from the market1.  The average dispersion between S&P 500® stocks over the twelve months of the year was just below 5%, which is the lowest value across the 23-year data set we’ve collected:

Average S&P 500 monthly dispersion

Source: S&P Dow Jones Indices, as of January 2014.

In such circumstances, the relative value of active management in the equity markets is constrained.  Simply put, accurate bets deliver less alpha. We recently predicted that assets in broad-based index trackers (ETFs in particular) would grow or have already grown larger than the entire hedge fund industry.  December’s numbers are now in for both industries2, and it seems that investors have been voting with their feet in favour of our prediction.  With the current lack of opportunities facing active managers, who can blame them?

___________________________________________

1. Of course, there were plenty of individual equities that recorded stellar or catastrophic performances. The point is that on average such instances were less commonplace – and less dramatic – than has historically been the case.

2. ETFs assets grew around 2% in December (according to Blackrock)

The posts on this blog are opinions, not advice. Please read our Disclaimers.

Getting Grim For Gold Miners?

Contributor Image
Jodie Gunzberg

Former Managing Director, Head of U.S. Equities

S&P Dow Jones Indices

If you are worried that gold prices are falling, the prognosis could be much worse for gold miner stocks. Although many investors believe the performance of gold miners is just like the performance of gold, this is not quite the case.  If investors look at correlations alone to determine they are getting their gold exposure through gold miner stocks, they are missing a big part of the picture.

The historical correlation of monthly returns between the S&P GSCI Gold (gold) and the S&P Global BMI Gold (gold miner stocks) from Jan 1995-Dec 2013 was 0.78, though it has ranged from 0.68 to 0.90 when looking at 3-year rolling periods and it is at its highest now.

GoldGoldMinerCorrel

So when analyzing the relationship between gold and gold miner stocks, from that perspective, it looks strong – but is potentially deceptive. 

There are influences on gold miner stocks that are less related to gold.  Generally the management of the companies aims to maximize shareholder value where decisions may be in or out of line with the gold price.  For example, decisions on dividends, debt/equity ratios, hedging out the price of gold or switching the metal they are actually mining may drive the stock price.  Sometimes even stocks that are classified as gold miners may have a greater percentage of revenue coming from other metals.

During the aforementioned period (Jan 1995-Dec 2013,) the S&P GSCI Gold returned 212.8% versus a loss for the S&P Global BMI Gold of 36.1%.

Gold Gold Miner CumRet

Why is this? The losses of the gold miners are so much bigger in the negative years for gold and not as positive in the positive years for gold. On average when gold lost in a year, it lost 12.1%, while gold miner stocks lost 27.7%.  When gold gained in a year, on average it returned 14.4% but gold miner stocks were only up 12.8%.

Gold Gold Miner Returns

Also, the annualized volatility of the gold miner stocks is 37.1%, double that of gold at 16.7%.

Gold Gold Miner Volatility

Although there have been years with positive gold returns and negative gold miner stock returns, there has never been a negative year for gold with a positive gold miner stock return. So, a falling gold price could be a bad sign for the gold miners.

The posts on this blog are opinions, not advice. Please read our Disclaimers.

Looking Back To Look Ahead

Contributor Image
Kevin Horan

Former Director, Fixed Income Indices

S&P Dow Jones Indices

In terms of fixed-income investing, 2013 is a year for the history books. Consequently, the question of what will 2014 bring for the fixed income investor arises. Some significant understanding of future fixed-income investing can be inferred from the recent past. The equity market had a very successful 2013 as the S&P 500 Index returned 29.6% for the year. Year-to-date, the stock market is down 0.38%, though we’ve only had a few trading days so far in 2014. For fixed income investments, yields have been on the rise going into the New Year and there are questions of the declining benefits of Fed stimulus, the timing of the tapering, and improving economics measured by jobs, manufacturing, and housing. This begs to question how much volatility equity and fixed income investments may experience.

In order to get a comparison between the two asset classes, the chart below looks at the daily total return of the S&P 500 Index and S&P Dow Jone’s fixed income indices over the past five years. The yearly standard deviation or volatility of daily returns for the S&P 500 has declined since the 2008 financial crisis, though with a 2013 volatility of 0.69, it is still higher than any of the fixed income indices. Treasury and senior bank loans, as measured by the S&P/BGCantor US Treasury Bond Index and the S&P/LSTA U.S. Leveraged Loan 100 Index, were the two fixed income indices whose volatility declined in 2013 to -0.147 and 0.056 respectively. The yields of indices may have started last year and ended this year rather close to each other with U.S. Treasuries, U.S. agencies, and investment grade corporates 30 to 50 basis points wider than they were at the start of the year. U.S. high yield and senior loans were tighter by 18 and 64 basis points, respectively. Given all the press that municipal bonds had received regarding Puerto Rico and Detroit throughout the year, it comes as no surprise that the S&P National AMT-Free Municipal Bond Index ended the year 100 basis points wider than it did at the start of the year when it was at a 3.06%. The S&P National AMT-Free Municipal Bond Index’s volatility rose 0.08 in 2013 to 0.206 from 2012’s level of 0.126. The S&P U.S. Issued Investment Grade Corporate Bond Index was not far behind municipals with an increase of 0.05, while the S&P U.S. Issued High Yield Corporate Bond Index’s volatility rose by 0.03 to 0.181.

Credit stories will continue to be an important factor in 2014 along with the changes in rates. With lower volatility to equity and a more predictability of returns, investors should take the volatility of the differing fixed income products compared with equity into consideration as they invest with the differing asset classes.

Looking Back To Look Ahead

The posts on this blog are opinions, not advice. Please read our Disclaimers.

Easing the Fed's Worries Over Quantitative Easing

Contributor Image
David Blitzer

Former Managing Director and Chairman of the Index Committee

S&P Dow Jones Indices

Yesterday’s release of the December 17-18 2013 FOMC minutes by the Fed revealed concerns about the side effects of the quantitative easing.  While these don’t suggest an accelerated end to the Fed’s bond buying – the popular guess is still that it winds down by year end – members of the Fed’s key policy-making group do have some concerns.

First is the thought that the current rock bottom interest rates may encourage financial risk taking and bubbles.  This has been widely discussed outside the Fed so its mention is not much of a surprise. In fact, one of the goals of QE 1-2-3 was to encourage more risk-taking to boost asset prices and begin restoring wealth that vanished in the financial crisis. However, the FOMC discussion adds an interesting observation: the asset buying, unlike targeting the Fed funds rate, not only keeps short term rates close to the zero lower bound, it also affects the spreads among different maturities.  While the Fed has long experience with managing the Fed funds rate, the only previous sustained effort to shift the spreads between different maturities of treasuries was back in the 1960s in a very different market.  Some FOMC members are apparently worried that there might be unexpected or unwanted results as the spreads narrow.

While QE does affect the spreads, the Fed’s forward guidance – forecasting what it expects to do – has a larger effect on spreads between treasury maturities than QE.  Once the central bank announces that short term rates will be very low for another two years, the spread between one and two years treasuries will shrink to those very low short term rates.  Either way, altering the differences among short, intermediate and long term treasury bonds is a new and novel policy tool for the Fed.

The discussion of QE also mentions impacts on the Fed’s profit position.  “Profit” should be in quotes.  When the Fed earns a profit, the proceeds go directly to the treasury. Moreover, since its principle source of income is interest on US treasury securities, the central bank is, in effect, reimbursing the Treasury.  The concern is more likely about appearances than actual profits and losses. Currently the Fed is holding a lot of treasury and mortgage securities; when interest rates rise the prices of these bonds will drop and the Fed will book a capital loss.  In addition, the Fed pays interest on the reserves banks keep at the Fed.  How would things look if the Fed were paying banks interest while it was losing money?  The small, dedicated and vocal group that wants to do away with the Fed might seize on such an event and create havoc in the financial markets.

No rush to end quantitative easing is likely. Even with these concerns, the FOMC expects to reduce the pace of QE gradually over future meetings. In fact the only dissenting vote argued that the Fed should wait awhile longer before cutting back on quantitative easing.

The posts on this blog are opinions, not advice. Please read our Disclaimers.

Everyone Complains About the Weather

Contributor Image
David Blitzer

Former Managing Director and Chairman of the Index Committee

S&P Dow Jones Indices

The universal complaint heard today is the “Arctic Vortex” and freezing temperatures across much of the US including financial centers in New York, Chicago and Boston. Are the cold and the weather just something to complain about or do they really affect people and the stock market?  There are various academic studies about how the weather might affect the market covering the US using New York City weather data, Australia and even Thailand.  The results for cold and stock prices are mixed: some find some weak connection between daily temperatures and stock price movements, some find no result at all.  However, a number of studies find a connection between sunshine or clouds and stock prices – if the morning is sunny, the market is more likely to advance.  While one day is clearly an insufficient sample, the sun is out in New York (despite the five degree temperature) and the market is up.  Clouds, overcast and rain seem to be associated with mixed to poor markets, probably another case of psychology and (ir)rationality driving stocks.

Cold does make one large, unfortunate difference: extreme cold, or hot, weather increases mortality rates. Cold is far more damaging than hot weather, so much so that one study found that people migrating to the southern states in the US is contributing to increasing life expectancy in the statistics.

The posts on this blog are opinions, not advice. Please read our Disclaimers.