This blog is the second in a three-part series introducing the S&P Risk Parity 2.0 Indices. The first blog highlighted the differences between these new indices and the original ones. In this installment, we will take a closer look at the methodology of the newly launched S&P Risk Parity 2.0 Index Series.
Constituent Changes
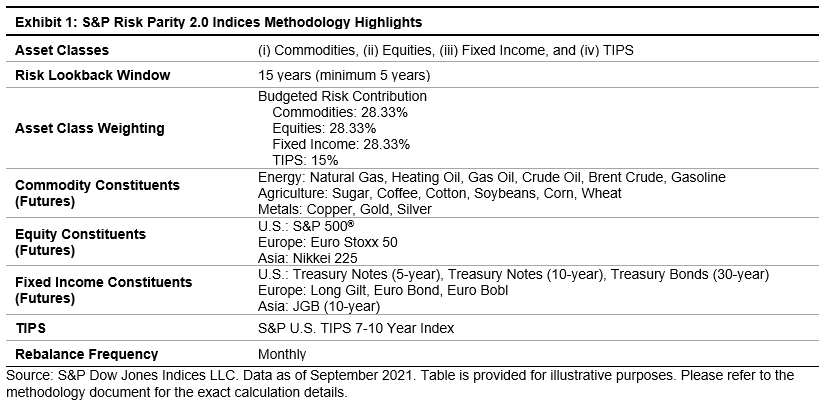
Incorporating TIPS
Although commodity prices tend to increase in value with rising inflation, many investors prefer to have a more explicit inflation hedge. Treasury inflation-protected securities (TIPS) are designed to increase in value to keep pace with inflation. Their principal is tied to inflation and interest is paid based on the adjusted principal.
In this index series, the S&P U.S. TIPS 7-10 Year Index was selected to represent TIPS. U.S. TIPS are typically liquid, especially across the 7-10-year maturities, which are of similar tenors to several of the other fixed income constituents included in the index.
TIPS as a Fourth Asset Class
When including TIPS in the index, thought had to be given as to how to position them—namely whether they should be bucketed with another asset class or stand alone. TIPS are not expected to react in similar ways to changes in growth and inflation as the other three asset classes (equities, nominal bonds, and commodities). But there were several other considerations when deciding whether to bucket with another asset class (i.e., comparison of volatilities, weighting approach, and impact on overall risk/return characteristics and leverage).
Overall, given the unique characteristics of TIPS, it was deemed most appropriate to include them as a separate asset class. Therefore, the S&P Risk Parity 2.0 Indices include four asset classes: equities, nominal bonds, commodities, and TIPS.
Allocation Changes
Marginal Contribution to Risk
Now that the S&P Risk Parity 2.0 Indices include TIPS, which have a 60-70% correlation with nominal bonds, Marginal Contribution to Risk (MCTR) is deemed a more comprehensive risk measure. It accounts for both correlation and volatility to assess the risk of each asset class in terms of its contribution to the overall portfolio.
Budgeted Risk Allocation
As part of the index design process, different risk budgets (such as 10%, 15%, 20%) were evaluated for TIPS. This analysis, as well as input from several market participants, led to the decision to allocate 15% risk to TIPS, with the remaining 85% risk split equally among equities, nominal bonds, and commodities.
Limiting TIPS to 15% was deemed most appropriate since it reduced the combined exposure to bonds (nominal and inflation-linked) as well as the overall leverage while still providing sufficient exposure to meaningfully contribute and to provide an inflation hedge.
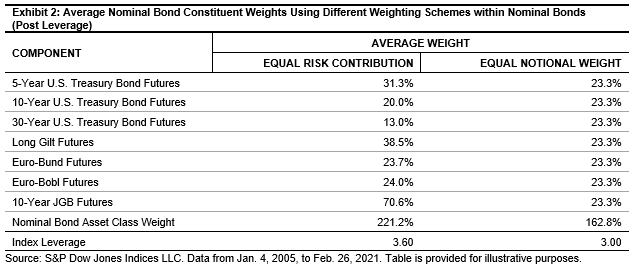
Equal Notional Weights within Nominal Bonds
Within the nominal bonds asset class bucket, 10-year JGB futures have the lowest volatility and correlation to other bond futures. If the risk is allocated equally across the constituents, roughly one-third of the asset class weight is allocated to JGB. Furthermore, it leads to a substantial increase to the asset class weight and to the overall leverage. To prevent this, the constituents in the nominal bond asset class bucket are equally weighted.
In the next blog, we will discuss the performance of these newly launched indices.
The posts on this blog are opinions, not advice. Please read our Disclaimers.