S&P GSCI Outpaced BCOM, Stocks and Bonds
We recently published The S&P GSCI: Built for the Cycle, a 10‑year analysis of how broad commodity indices behaved across differing inflation regimes, and why the S&P GSCI’s production‑weighted design historically demonstrated a higher inflation beta than alternatives such as the Bloomberg Commodity Index (BCOM). This blog is a follow‑up, turning the focus to 2026 YTD performance. In the first five months of 2026, inflation re‑accelerated due to global conflicts constraining energy supplies. YTD performance aligned with findings explored in the longer study.
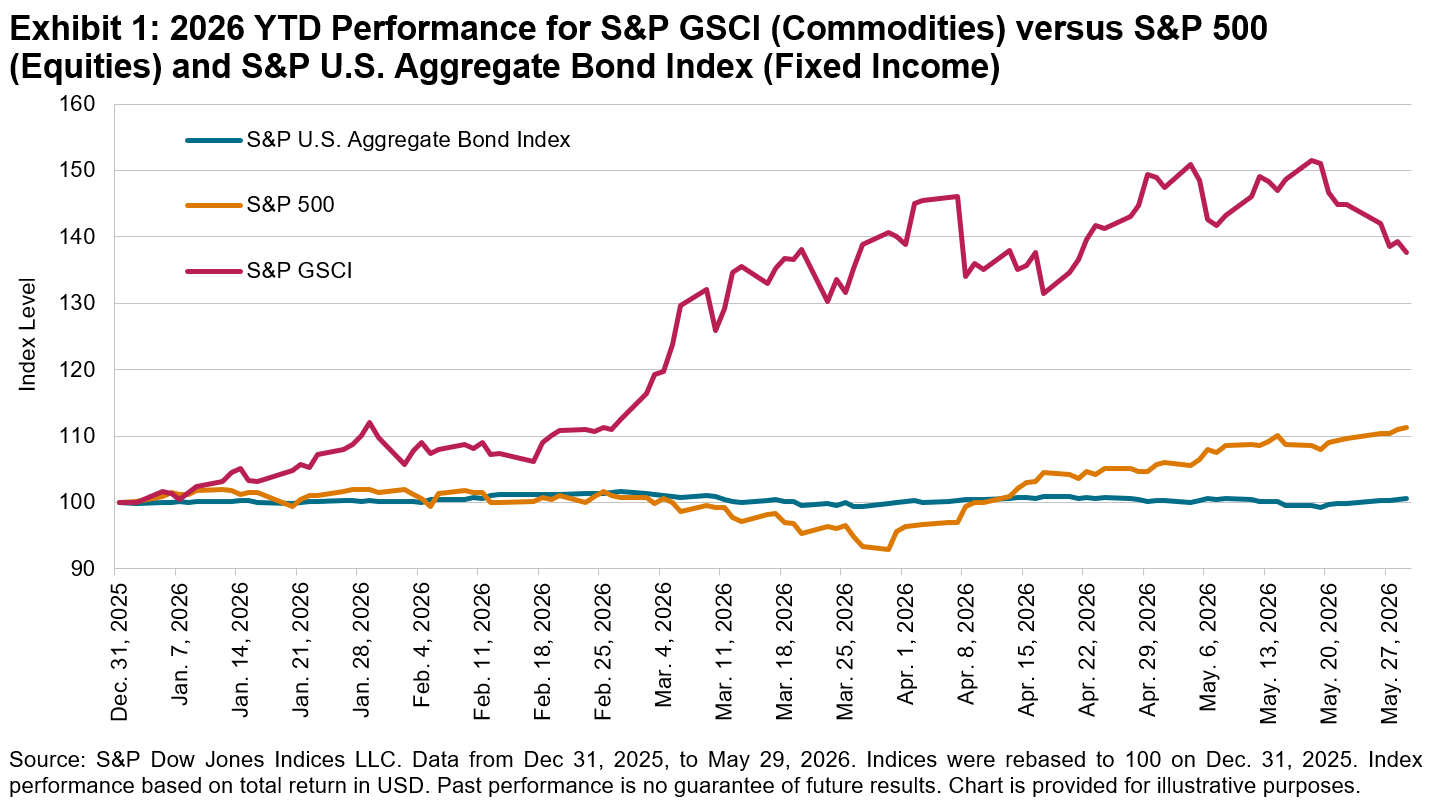
The S&P GSCI rose 37.7% through May 29, 2026, outperforming the Bloomberg Commodity Index (BCOM), which gained 25.0%. Both commodity benchmarks meaningfully outperformed equities (the S&P 500® was up 11.3%) and bonds (the S&P U.S. Aggregate Bond Index was up 0.6%) during the period. We’ll see how an inflation shock highlighted the inflation-hedging characteristics of commodities, the implications of production weighting in the S&P GSCI and the substantial contribution of the Energy sector to commodity performance.
Commodities Outperformed as Inflation Accelerated
After ending 2025 at about 2.7% year-over-year, U.S. consumer inflation (CPI-U) climbed to about 4.3% year-over-year by May 2026, an increase of 1.6 percentage points since the start of the year. A key driver was rising energy prices, due to a sharp oil price shock that rippled through broader prices.
Historically, inflation shocks have typically benefited commodities, and 2026 was a textbook example. Commodity performance took off in early 2026 as inflation rose. By late March, the S&P GSCI TR had climbed to double-digit gains, peaking in mid-May with a YTD increase of over 50% before settling at 37.7% at the end of May. In contrast, the S&P 500 TR ended May up a solid but considerably lower 11.3%, while the S&P U.S. Aggregate Bond Index was essentially flat (up 0.6%) over the same period. In short, commodities (especially those that are Energy driven) significantly outperformed traditional assets during this inflationary spike.
GSCI versus BCOM: Production Weighting Shows Its Value
Within commodities, the S&P GSCI outpaced BCOM YTD in 2026, continuing a familiar pattern from the past decade. Through the end of May, the S&P GSCI’s gain of 37.7% topped the BCOM’s 25.0% by over 12 percentage points. This outperformance under inflationary conditions is consistent with the findings of the 10-year analysis: the S&P GSCI’s inflation beta was about 1.7× higher than the BCOM’s (9.1 versus 5.5, respectively), meaning that the S&P GSCI has historically moved about 65% more for each 1% move in inflation. The 2026 YTD data were consistent with this relationship, with the S&P GSCI reacting more strongly to the inflation surprise than BCOM.
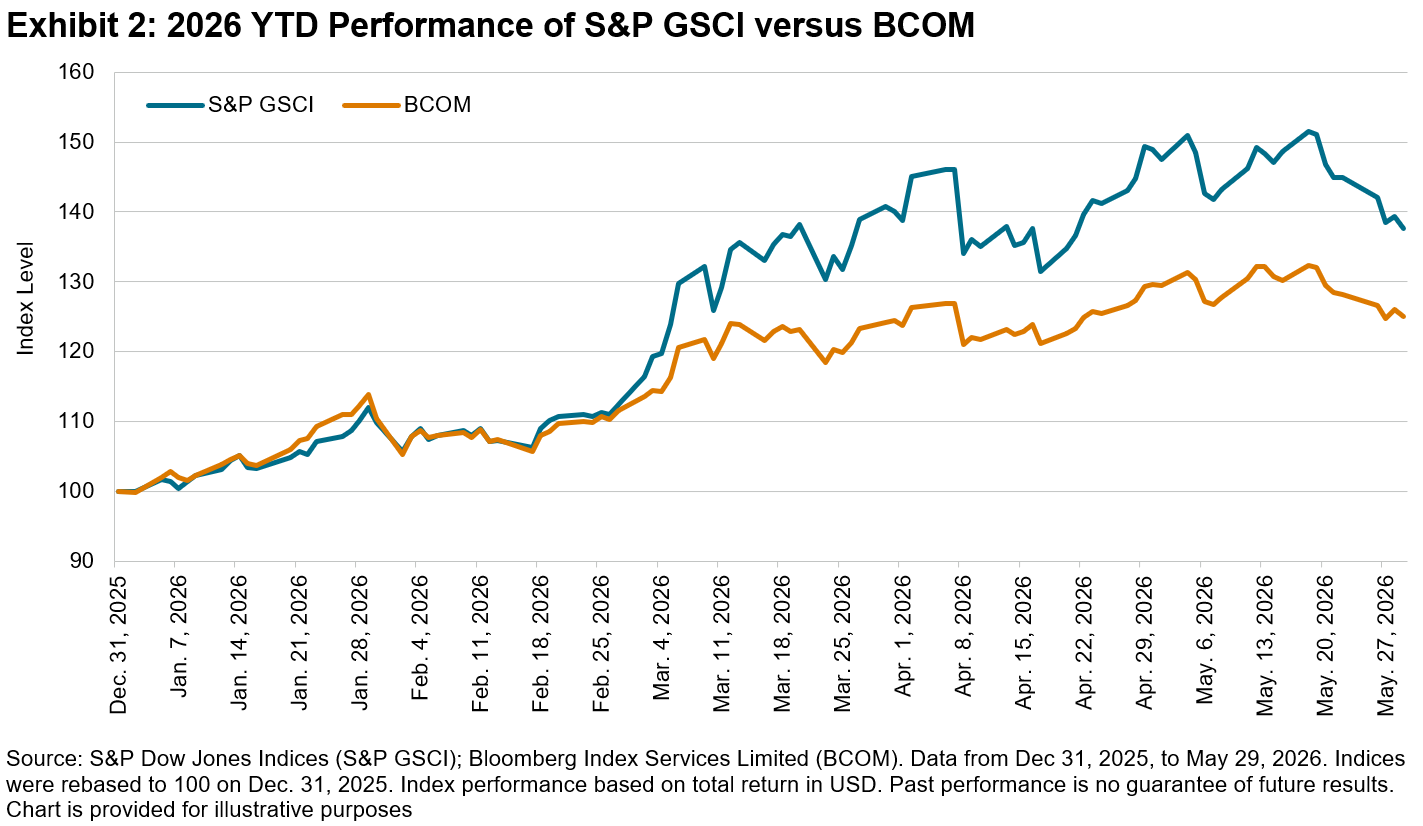
To explain the S&P GSCI’s outperformance, we can point to the production-weighted structure embedded in the index weighting scheme, which may have contributed to relative performance when inflation-hedging characteristics were particularly relevant. This result is consistent with findings from the past decade—the S&P GSCI has exhibited stronger performance in higher-inflation regimes.
Energy Takes the Lead in 2026
The 2026 commodity rally was led by Energy. Within the S&P GSCI, the Energy sector gained 76.3% through the end of May, significantly exceeding the gains in all other sectors. For context, Industrial Metals was up 16.0%, Precious Metals rose 5.3%, and Agriculture and Livestock each climbed roughly 2% YTD.
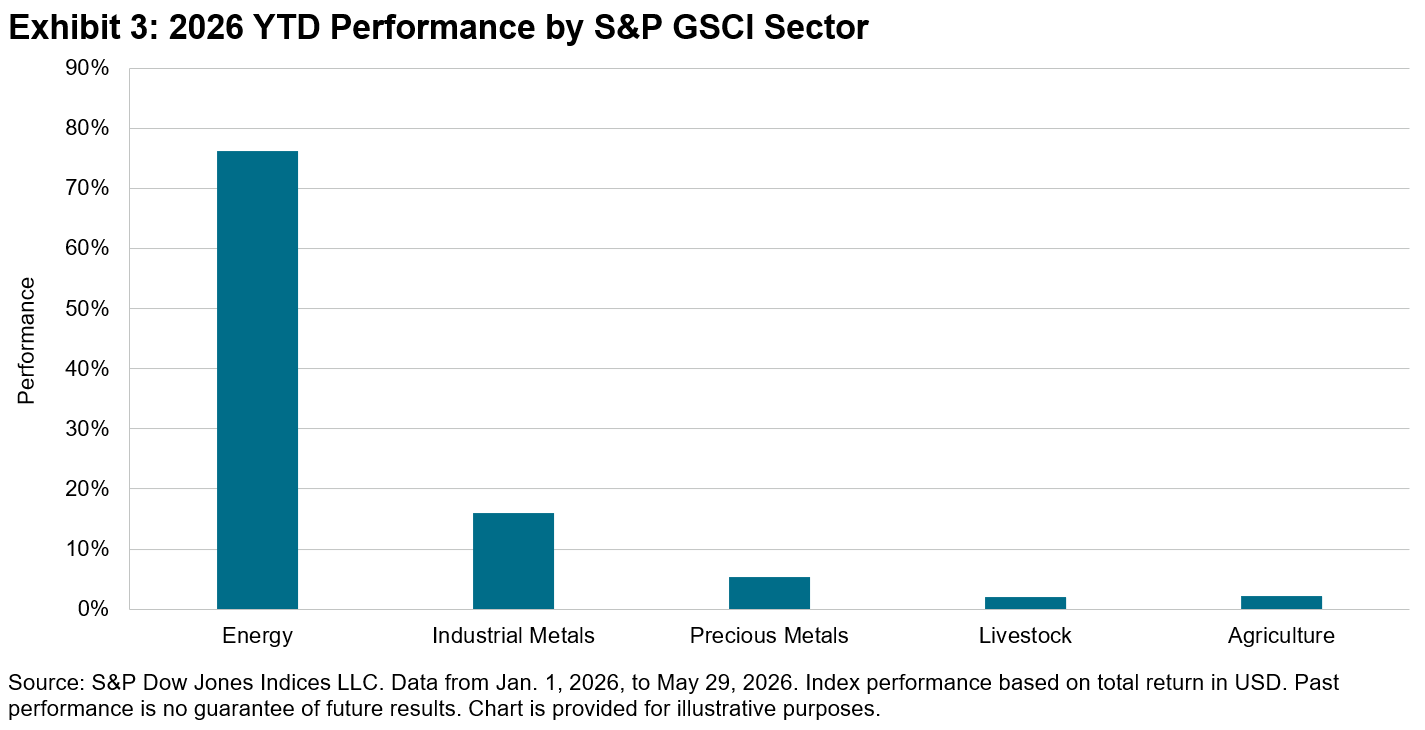
These figures are consistent with the central findings of The S&P GSCI: Built for the Cycle, which highlighted how production weighting aligns a commodity index with the real-economy cost structure. When Energy prices have risen, an index weighted by the scale of global production tended to reflect that move in proportion to Energy’s economic footprint. The heavy Energy weight in the S&P GSCI is an important characteristic of inflation-responsive commodity weighting. Of course, greater sensitivity means accepting higher volatility, but as YTD 2026 has shown, the advantages could be significant during inflationary surges.
This content may be AI-assisted and is composed, reviewed, edited, and approved by S&P Global.
The posts on this blog are opinions, not advice. Please read our Disclaimers.