The rally in U.S. equities continued in May, with the S&P 500® posting 11 all-time closing highs during the month. A key catalyst for the market’s upward march has been optimism surrounding companies benefiting from the boom in AI. The beneficiaries of the investment in AI are no longer just the mega-cap hyperscalers, but the rapidly growing companies situated within the technology hardware and semiconductors industries.
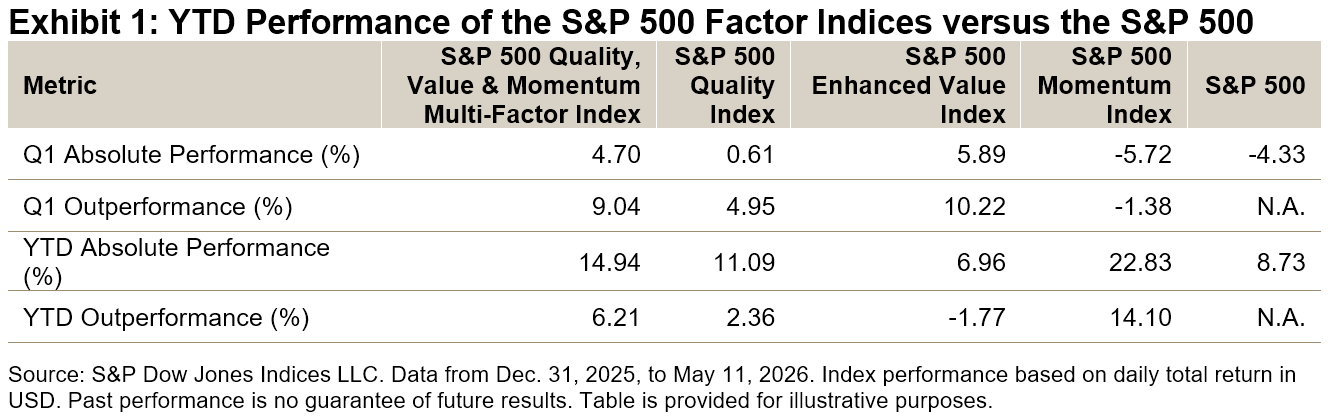
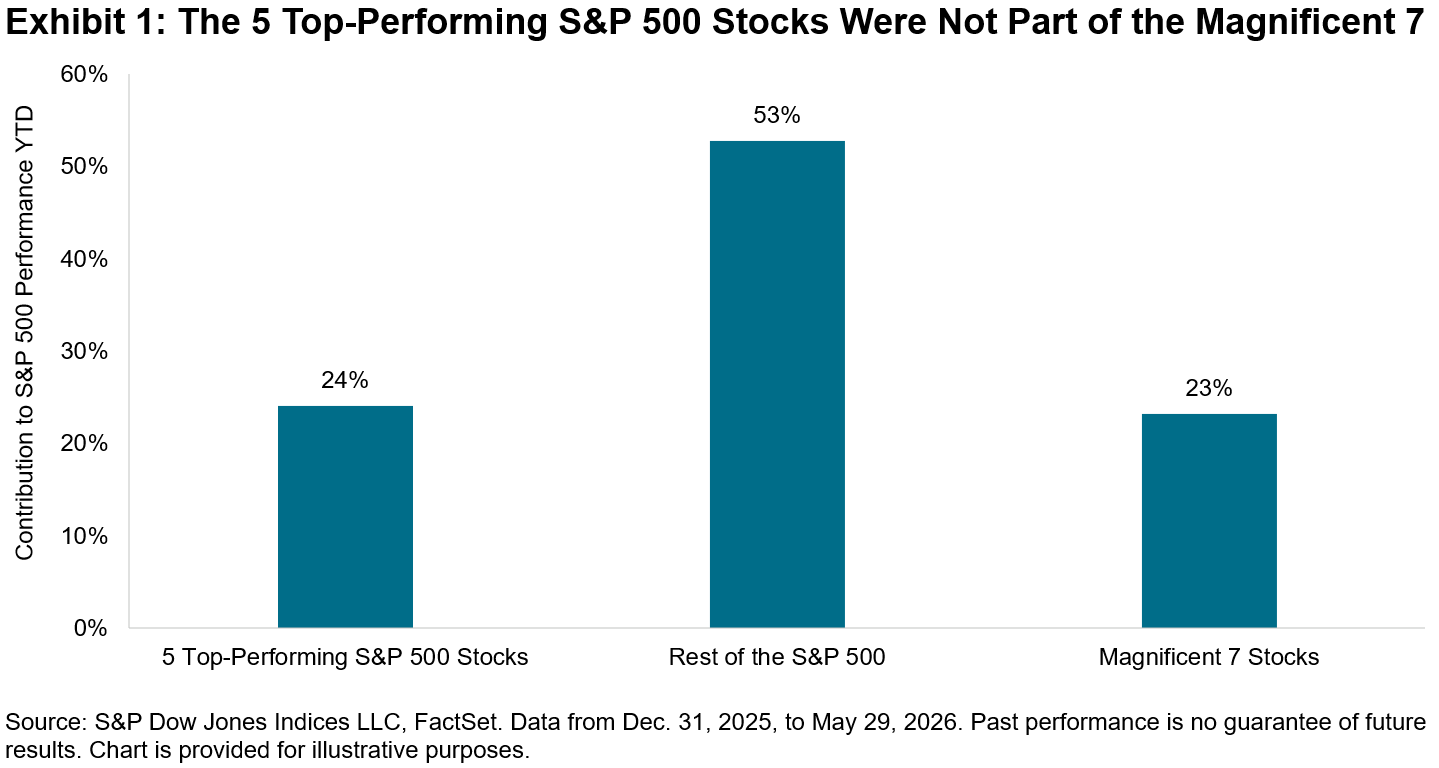
Exhibit 1 shows that almost a quarter of the S&P 500’s YTD performance was contributed by the five top-performing stocks within the 500. Notably, none of these companies are part of the “Magnificent 7”, the members of which contributed a similar magnitude to the index’s performance. Instead, these leaders are part of a growing cohort of chipmakers, including the latest addition to the trillion dollar club Micron Technology, as well as older stalwart and survivor of the tech bubble Intel.
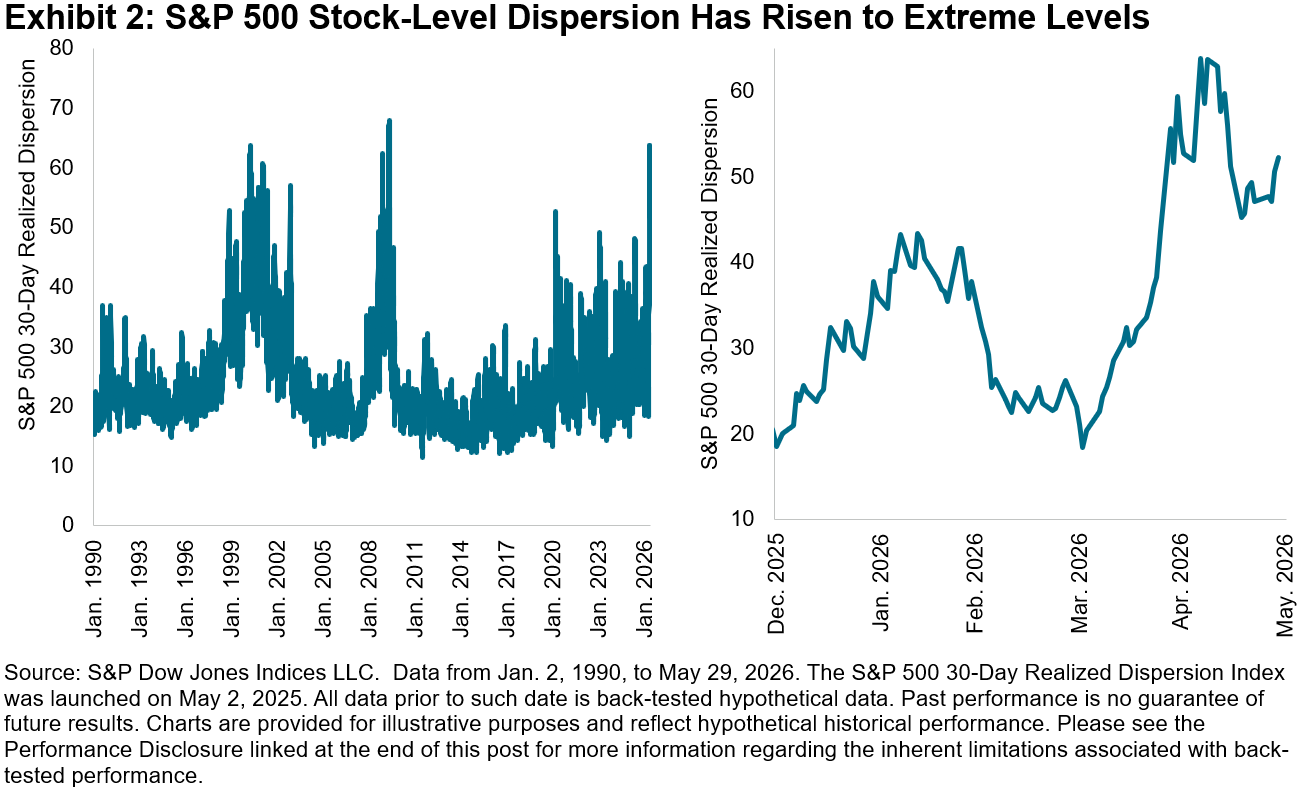
As investors have become more discerning in assessing the winners and losers of the AI trade, cross-sectional volatility—or dispersion, which measures how differently stocks are performing relative to each other—has risen to extreme levels relative to history. These levels were surpassed only by May 2009, as the market began its recovery from the Global Financial Crisis. The value of stock-selection skill rises when dispersion is high, which can mean greater opportunities for skillful stock pickers to outperform.
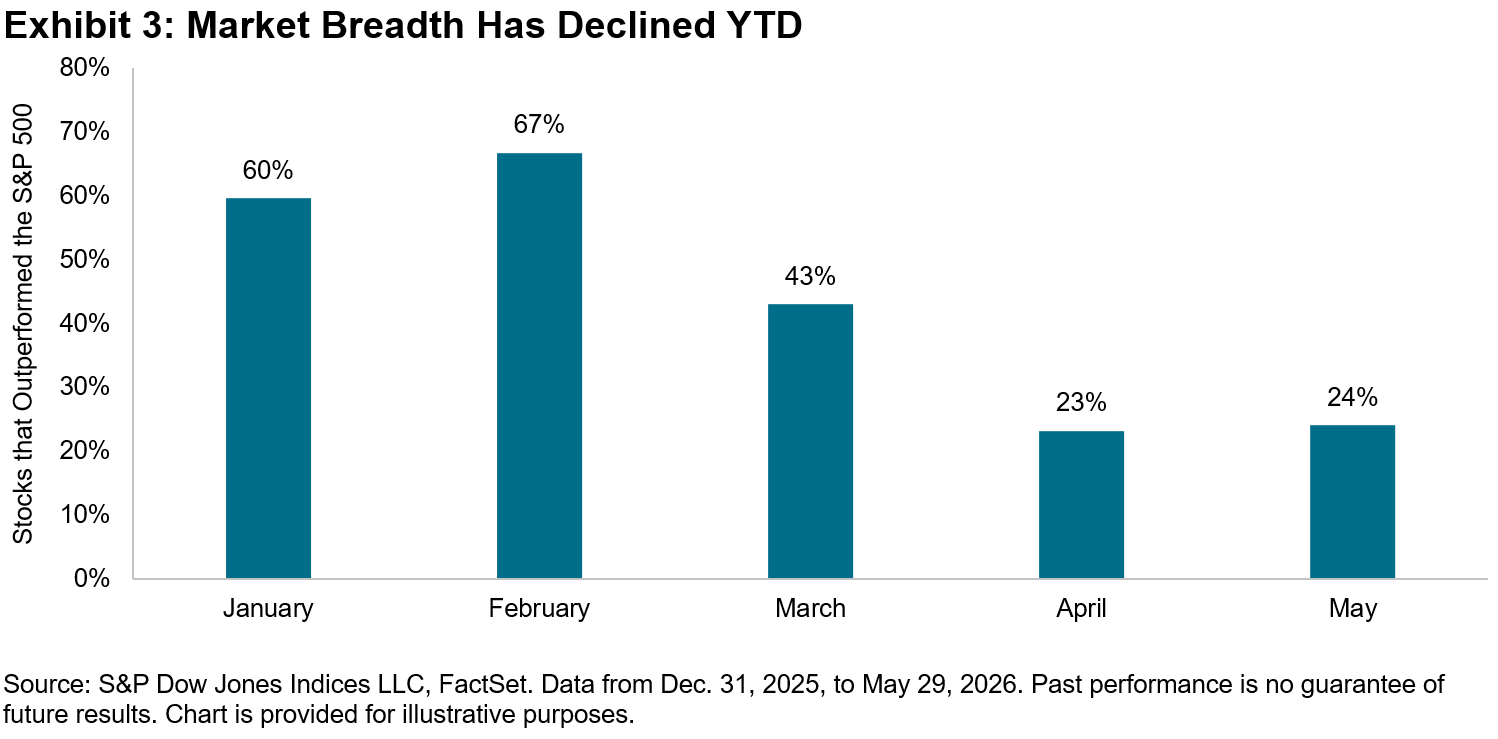
Meanwhile, although the spread between outperforming and underperforming stocks has widened, market breadth—defined as the percentage of stocks outperforming the benchmark—has steadily declined this year. In May, 24% of stocks beat the S&P 500, declining by more than half compared to February, when 67% of stocks outperformed the index. Since then, market leadership has become more concentrated, shifting from smaller caps to a handful of large caps, which can make conditions more challenging for high-conviction managers who may be underweight the largest stocks while also holding a fewer number of the likely winners.
Active managers generally fared better during high dispersion periods, but how have stock pickers fared historically during periods of narrow breadth? Looking to history for a better understanding of active manager performance trends, we can analyze the 25-year history of our SPIVA® U.S. Scorecard, which measures the performance of active managers versus their appropriate benchmarks.
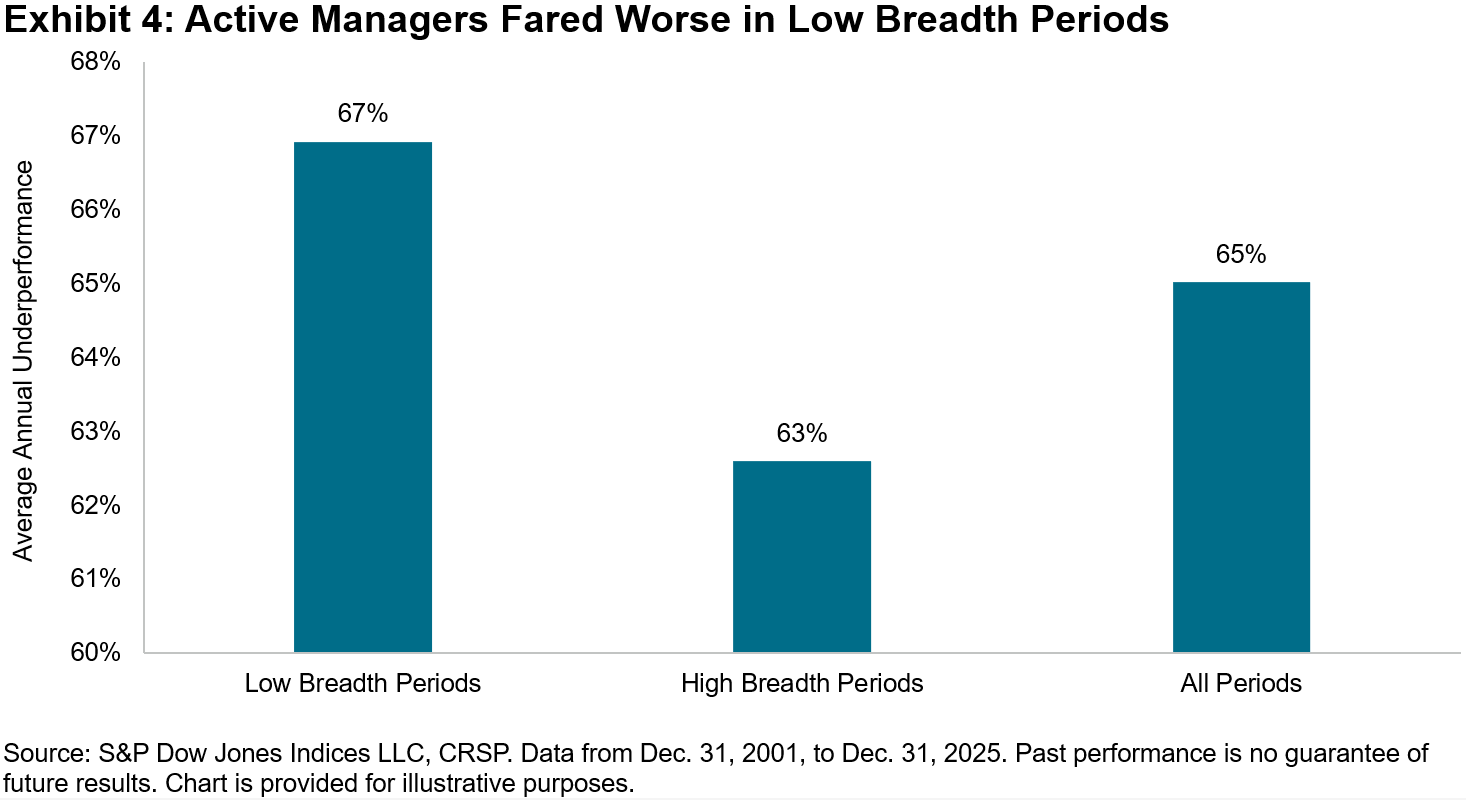
In Exhibit 4, we divided the years in our SPIVA database into low and high breadth periods, defined as when the percentage of stocks beating the benchmark S&P 500 was below 50% and above 50%, respectively. As expected, large-cap managers generally did worse in low breadth periods, with 67% underperforming the S&P 500, higher than the 63% during high breadth periods. Still, high breadth regimes were characterized by majority underperformance.
As we approach the second half of 2026, we can look to implied dispersion to understand the potential for future opportunities for stock selection. The Cboe S&P 500 Dispersion Index (DSPX), which uses listed options to measure the expectations for dispersion over the next 30 calendar days, rose to a one-year high of 42.01 on the last trading day of May. This means the market expects that the spread of annualized S&P 500 stock returns will have a standard deviation of 42% next month and may signify positive prospects for active stock selection.
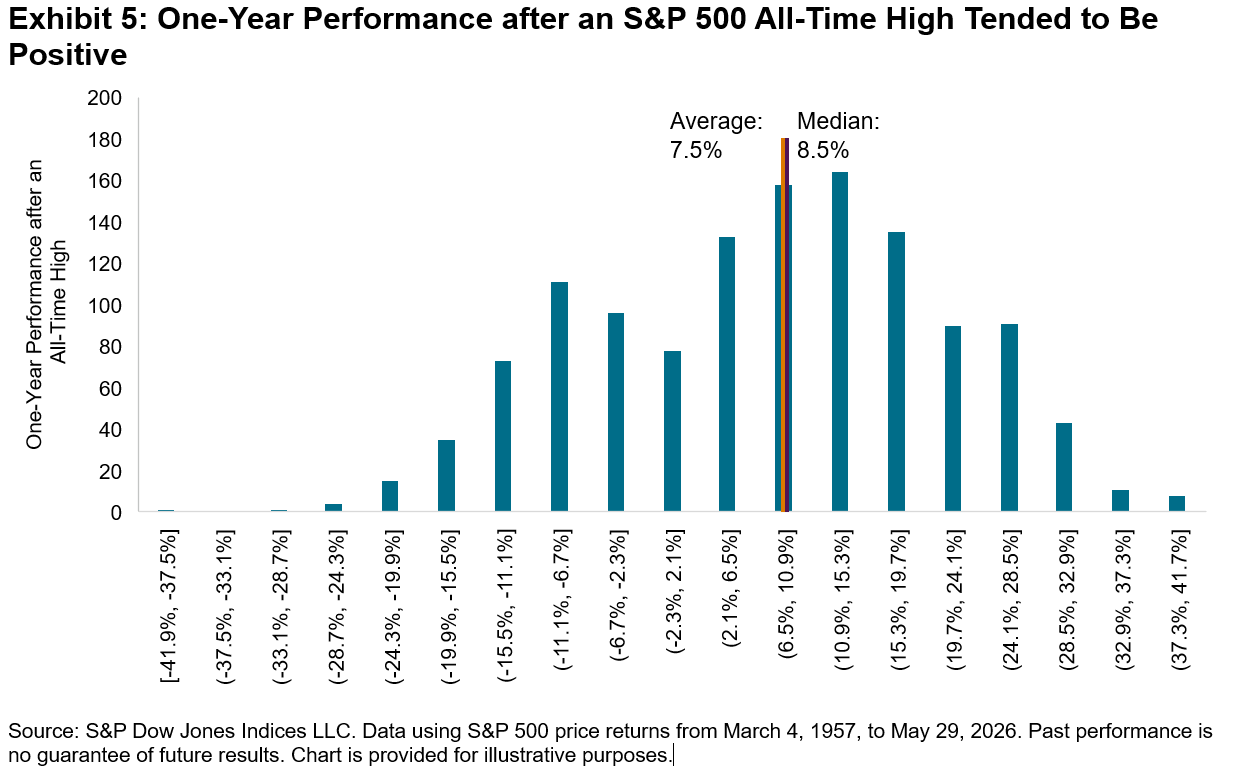
But if the market continues its advance upwards and breadth remains narrow, that could create a higher hurdle for constituent stocks to beat and for the stock pickers attempting to outperform the benchmark. Exhibit 5 shows that, historically, S&P 500 all-time highs have been followed by an annual average gain of 7.5%, slightly below the median of 8.5%. Extremes include the 42% decline after the all-time high in October 2007, when the market subsequently entered a bear market, and the 40% gain after the all-time high in October 1996, when the market continued its momentous bull run.
Today’s environment, characterized by soaring valuations and the fervor toward spending on memory chips, is reminiscent of the late 1990s. Of course, the dot-com bubble popped in 2000, but no one knows if we are in the midst of a bubble that may soon burst. For those high-conviction managers who may be capitalizing on a higher dispersion environment, the headwinds from narrow breadth may be a much-needed warning.
The posts on this blog are opinions, not advice. Please read our Disclaimers.