Get Indexology® Blog updates via email.

In This List

Index-Based Investing in Islamic Finance: Trends and Implications

Measuring the Global Timber and Forestry Opportunity Set

Shifting Equity Sensitivities with S&P 500 Sectors

The Global Equity Landscape: Struggles and Surprises in 2024

Diversifying Exceptionalism

Index-Based Investing in Islamic Finance: Trends and Implications

Contributor Image
Sue Lee

Director and APAC Head of Index Investment Strategy

S&P Dow Jones Indices

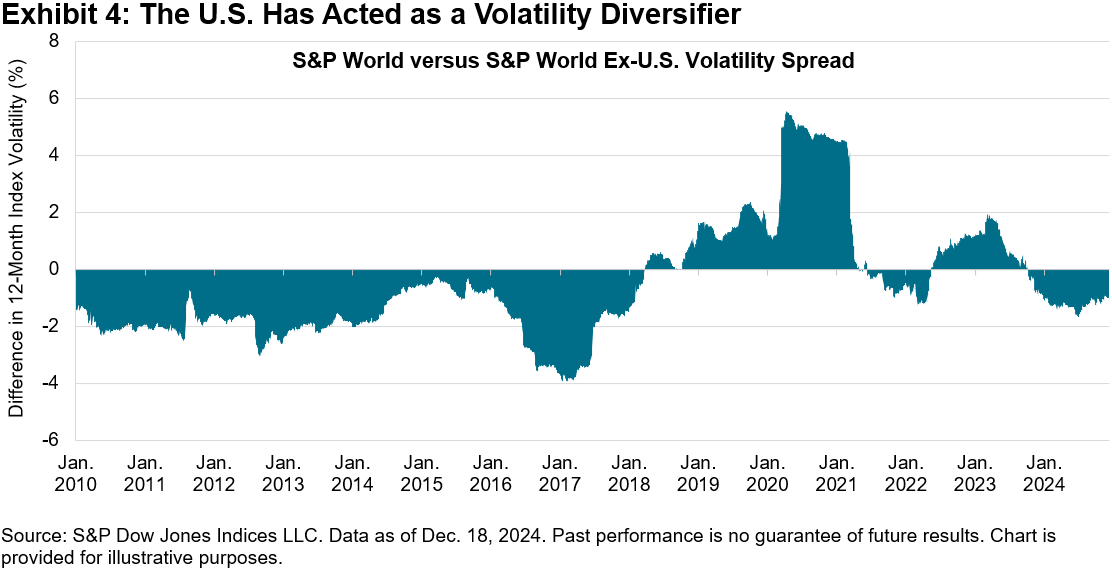
Indices play a crucial role in Islamic finance by identifying the universe of securities eligible for Shariah-compliant investments, establishing the benchmarks by which Islamic market participants assess performance and increasingly serving as the basis for index-linked investment products. Islamic finance has also embraced the global trend toward index-based or “passive” investing,1 with assets in exchange-traded funds (ETFs) linked to Islamic indices reaching USD 4.6 billion in 2024, a 49% increase YTD (see Exhibit 1).
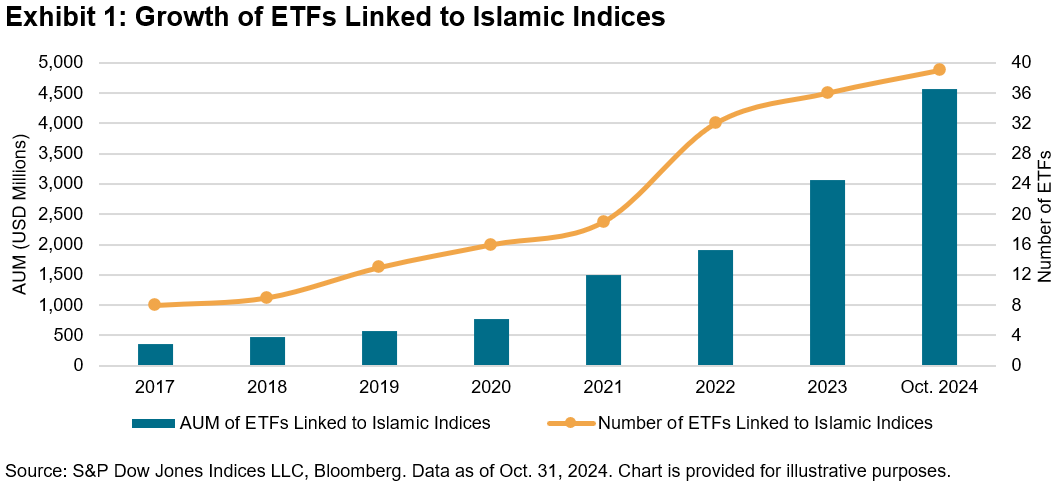
Review of 2024

Global equities had a robust year, with the S&P Global BMI returning 15.4% by the end of October 2024. Shariah-compliant global equities outperformed slightly, with returns of 15.7% and 15.9% for the S&P Global BMI Shariah and Dow Jones Islamic Market (DJIM) World Index, respectively. Over the past five years, Shariah equity benchmarks have generated an excess return of more than 15% (2.0% annualized) over their conventional counterparts, as Exhibit 2 illustrates.

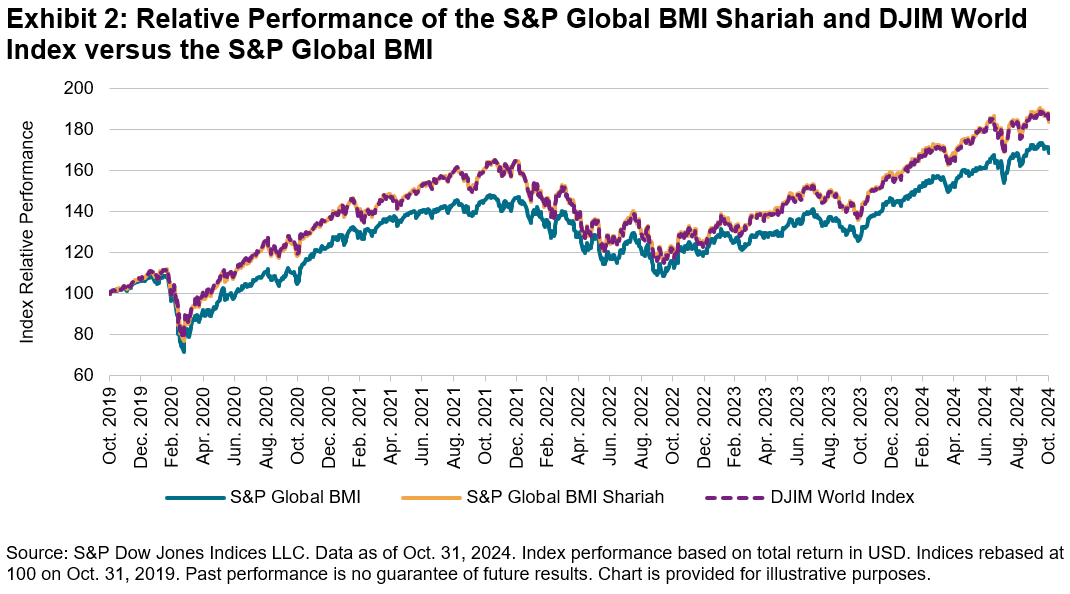
The relative performance of Islamic indices is partly attributable to their differing sector allocations. Information Technology, which accounts for 42.8% in the S&P Global BMI Shariah versus 23.4% in the S&P Global BMI, contributed 50% of the Shariah index’s return. This sector alone helped to generate an excess return of 2.8% against the conventional benchmark YTD. On the other hand, Financials brought the most significant negative effect on the index with a -3.0% excess return. This was due to its reduced weightings (3.6% in the S&P Global BMI Shariah versus 16.6% in the S&P Global BMI) as well as the underperformance of Shariah-compliant Financials companies against non-compliant ones (see Exhibit 3).

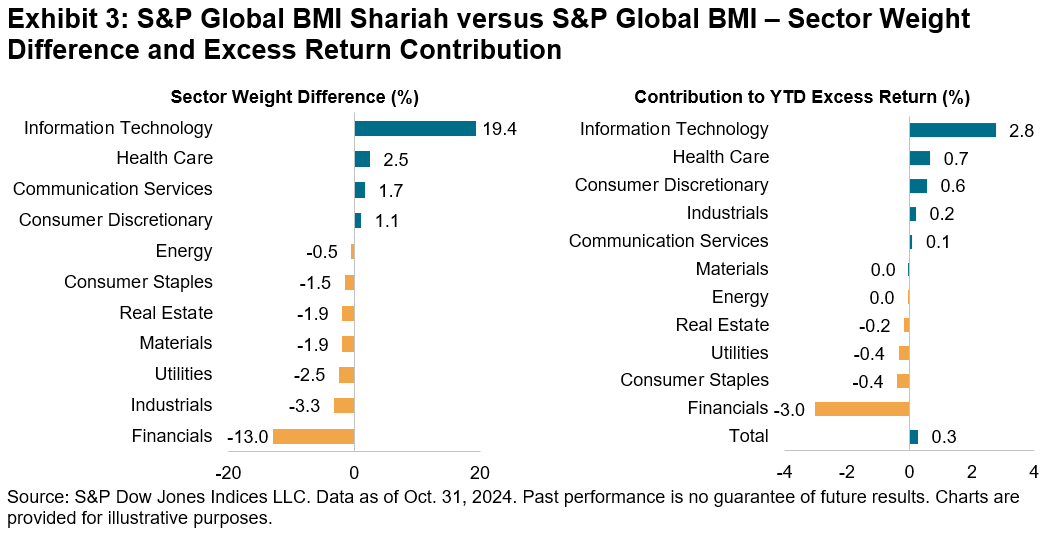
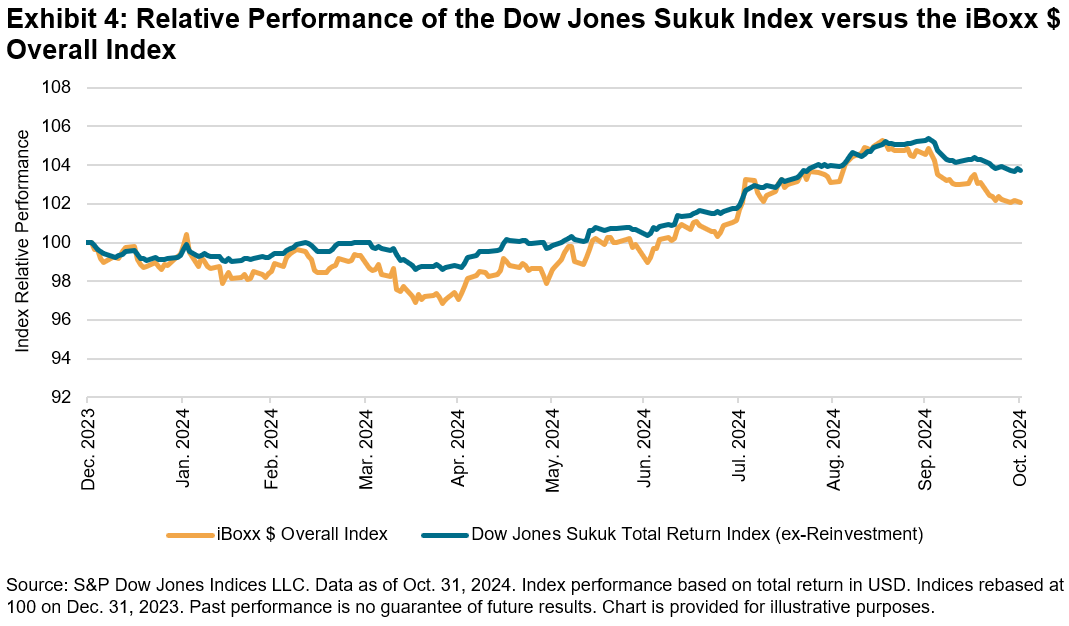
Meanwhile, fixed income markets were sluggish initially but rose in Q3, with U.S. dollar-denominated investment grade bonds (as measured by the iBoxx $ Overall Index) gaining 2.1% YTD as of the end of October 2024. Its sukuk equivalent, the Dow Jones Sukuk Index, had a higher return of 3.7% due to a larger compression in credit spreads and the lower duration of sukuk issues, which made them less sensitive to the repricing of rates2 (see Exhibit 4).

Against this backdrop, as already indicated by Exhibit 1, ETFs linked to Islamic indices have seen notable inflows. While the largest portion (46%) of assets under management are associated to U.K. primary listings, assets in U.S.-listed ETFs grew by 82% YTD and now account for 42% of the total. Islamic ETFs are predominantly in the broad-market equities space (94% of the total assets under management), while sukuk ETFs are growing fast with a 73% YTD increase as of the end of October 2024.

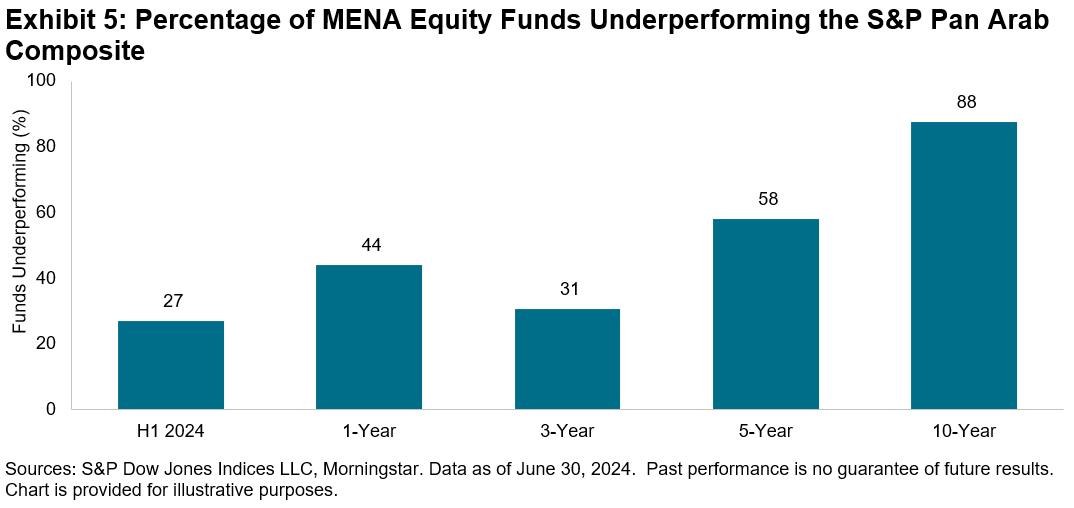
In the Middle East and North Africa (MENA) region, passive investing is still in its early stage. However, the U.A.E. and Saudi Arabia have been leading the development of the local ETF markets and introduced several new ETFs this year. The benefits of passive investing are resonating with MENA-based market participants, supported by empirical evidence from the S&P Indices versus Active (SPIVA®) research. Despite relatively encouraging results in H1 2024, actively managed MENA equity funds largely underperformed the S&P Pan Arab Composite over a 10-year period, as illustrated in Exhibit 5.3

Looking Ahead

A significant trend in Islamic indexing is the emergence of ESG Shariah solutions and increased interest in this space. Shariah and ESG principles share some common goals, such as promoting social and environmental stewardship. The S&P Pan Arab Composite ESG Shariah Capped Index exemplifies this concept, as the index measures the performance of the 40 companies with the highest-ranking ESG scores among the 60 largest constituents of its benchmark, the S&P Pan Arab Composite Shariah Index. Since its launch in May 2022, the index has achieved ESG score improvements and better temperature alignment, along with marginal outperformance compared to its benchmark.4 We will continue to observe how indexing evolves to help align Islamic values and ESG goals.

There are also some challenges ahead. In late 2023, the Accounting and Auditing Organization for Islamic Financial Institutions (AAOIFI), the Bahrain-based supervisory body for Islamic finance standards, released a draft standard aimed at redefining the concept and structure of sukuk.5 The proposal requires that sukuk be backed by underlying assets rather than merely referencing these assets in their structure, as has been the practice. S&P Global Ratings has stated that adopting this new standard could disrupt the market, lead to further market fragmentation, dampen the appetite of both investors and issuers, and potentially halt new issuance until sukuk structures find a middle ground.6 The publication and effective date of the standard are still unknown, and it remains to be seen how the final standard will be enforced and how the sukuk market will adapt in 2025.

Conclusion

The landscape of Islamic index-based investing is evolving, driven by increasing market participant demand and the adoption of global market trends. The outperformance of Shariah-compliant indices and the rapid growth of associated ETFs underscore the potential for passive investment strategies in this sector. However, challenges such as regulatory changes and market fragmentation must be addressed to maintain this momentum. As the market continues to adapt, ongoing innovation and alignment with market participant values will be essential for the future success of Islamic indexing.

This article was first published in IFN Annual Guide 2025.


1 See It’s Official: Passive Funds Overtake Active Funds, Morningstar, January 2024

2 As of the end of October 2024, the Dow Jones Sukuk Index had 4.35 years of effective duration and a yield of 4.89% with a 67 bps spread over U.S. Treasury bonds. In comparison, the iBoxx $ Overall Index had 5.99 years of duration and a yield of 4.85% with a 40 bps spread.

3 See SPIVA Global Mid-Year 2024, S&P Dow Jones Indices, October 2024

4 See Where Shariah Meets ESG, S&P Dow Jones Indices, July 2024

5 See AAOIFI Shariah Board Ratifies Landmark Sukuk Standard Draft, Solicits Banking and Regulatory Sector Feedback, AAOIFI

6 See Sukuk Market: The Calm Before the Storm?, S&P Global Ratings, July 2024

The posts on this blog are opinions, not advice. Please read our Disclaimers.

Measuring the Global Timber and Forestry Opportunity Set

How does the S&P Global Timber & Forestry Index work? Examine a benchmark tracking companies that own, manage, harvest and process these crucial natural resources, while also incorporating governance and sustainability screens.

The posts on this blog are opinions, not advice. Please read our Disclaimers.

Shifting Equity Sensitivities with S&P 500 Sectors

Contributor Image
Sherifa Issifu

Associate Director, Global Exchanges

S&P Dow Jones Indices

Broad-based benchmarks such as the S&P 500® and S&P SmallCap 600® demonstrated an upbeat response to the U.S. presidential election, rising 6% and 11%, respectively, in November 2024. The spread in U.S. size segments was more muted relative to S&P 500 sectors.  Exhibit 1 presents the November 2024 cumulative total return of the S&P 500 versus different U.S. equity size indices on the left-hand side and, on the right, compared to its 11 GICS® sector subindices.

Following the U.S. election, sector returns showed considerable divergence. While all 11 sectors ended November in positive territory, they had very different paths, with Health Care among the laggards, ending the month with a gain of only 0.3%. In contrast, more domestically focused sectors such as Financials, Industrials and Energy were among the outperformers, just behind Consumer Discretionary. This higher dispersion created opportunities for both outperformance and underperformance for those willing to examine U.S. equity performance closely.

The S&P 500’s GICS sectors can deviate significantly from both the performance and characteristics of the S&P 500. When examining which sectors derive most of their revenue domestically, Utilities and Information Technology (IT) are on opposite ends of the spectrum. Exhibit 2 shows that, in aggregate, companies in the S&P 500 Utilities derive nearly all of their revenues domestically at 98%, while IT is the only sector that derives over 50% of its revenue from outside the U.S.

Traditionally, market participants have tended to have higher exposure to domestic biases and thereby sectors that align with their regional bias. Exhibit 3 highlights that the largest sector weights in various regions are to “traditional” economy sectors: in Europe, it is Industrials; in the Middle East and Africa, it is Financials; and in Latin America, it is Materials. Some of those “traditional” economy sectors (such as Financials and Industrials) tend to derive more of their revenues domestically. In contrast, the U.S. Information Technology sector derives more of its revenues internationally, with the inclusion of mega-cap tech companies like Apple and Microsoft (see Exhibit 2).

The market capitalization of many individual U.S. sectors is also equal to the entire opportunity set of individual regional stock markets. Exhibit 4 demonstrates that the S&P 500 Information Technology sector is larger than China, while U.S. Financials is similar in size to Japan’s entire equity market.

The size of U.S. sectors in any equity allocation decision could be as important as country exposures when looking at the sheer size of the segments. As a result, S&P 500 sectors may be a useful tool for market participants interested in exposure to sectors of varying sensitivity to the U.S. economy while also adding different geographical revenue exposures to their strategies. With the U.S. making up such a significant portion of global sectors, S&P 500 sectors could arguably help to reduce “home bias.”1

1 “Home bias” here is defined as market participants having a larger exposure to domestic equities than their weight in a global equity opportunity set.


The posts on this blog are opinions, not advice. Please read our Disclaimers.

The Global Equity Landscape: Struggles and Surprises in 2024

Contributor Image
Benedek Vörös

Director, Index Investment Strategy

S&P Dow Jones Indices

U.S. equity markets enjoyed a great year in 2024, but the returns in many developed equity markets were found wanting in relative terms and, in many cases, absolute terms as well.

With just a few trading days left in 2024, the S&P Developed BMI has gained 22% YTD as of Dec. 13, 2024, with all but 3 of its 25 members lagging the benchmark. Five regions produced outright losses YTD, with Korea at the bottom of the list, down 18%. Of the remaining 20 markets, 10 produced returns in the single-digit percentages, and only 3 (the U.S., Singapore and Israel) were up over 20%.

Among developed markets, Japan not only kept up with the U.S. until the beginning of August, but it was even ahead until early May. On the back of this year’s gains, the local currency version of the S&P Japan BMI finally surpassed its prior all-time high recorded on Dec. 18, 1989. However, investors in the local market didn’t have long to celebrate.

In the beginning of August, the Bank of Japan surprised market participants with an unexpected monetary tightening at a time when the world’s other major central banks were already in easing mode. The Bank of Japan’s action triggered turmoil in capital markets around the world, with Japan at the epicenter. The Japanese yen had aggressive moves in both directions, and so did the S&P Japan BMI, which had its worst one-day loss ever on Aug. 6, 2024, falling over 12%, followed by its third-best day ever the next day as the Bank of Japan made a policy U-turn. Markets have calmed since the early August volatility, and the Japanese benchmark rebounded 24% from its Aug. 5 lows to show a YTD gain of 18%.

Investors in emerging markets had to contend with generally lower returns than those in developed markets, with the S&P Emerging BMI lagging the S&P World Index by 8% YTD. Emerging market investor attention this year has been focused on Asia’s two giants and their diverging economic and stock market fortunes. On the one hand, Chinese equities had been grinding steadily lower until mid-September, with the S&P China BMI PR down for the year as recently as Sept. 23, as the country’s economic growth sputtered.

The S&P India BMI, on the other hand, soared 26% over the same horizon, and, consequently, came within a whisker of overtaking China as the region with the largest weight within the S&P Emerging BMI. Since then, China’s weight in the emerging market benchmark rebounded together with local equities, which rose over 20% on the back of the government’s latest round of stimulus measures. However, doubts still remain about whether the latest policy actions will produce a lasting recovery in 2025 and beyond.

As we approach the end of 2024 and head into 2025, the contrasting performance patterns of various developed and emerging markets around the world underscore the complexities that investors may face, highlighting the need for careful analysis and strategic positioning in an ever-evolving global landscape of equity markets.

The posts on this blog are opinions, not advice. Please read our Disclaimers.

Diversifying Exceptionalism

Contributor Image
Anu Ganti

Head of U.S. Index Investment Strategy

S&P Dow Jones Indices

Despite recent sharp U.S. market declines after the Federal Reserve signaled fewer than expected rate cuts, much of recent year-end market commentary has been focused on U.S. exceptionalism and the divergence of U.S. equities compared to the rest of the world. The S&P 500® was up 24.8% YTD through Dec. 18, 2024, reaching 57 all-time closing highs so far this year, propelled by robust economic growth, AI-related enthusiasm and optimism surrounding President-elect Trump’s return.

Exhibit 1 shows that U.S. outperformance is not a new phenomenon. The S&P 500 has significantly outperformed the rest of the world over the past fifteen years, with a cumulative return of 887% since Dec. 31, 2008, compared to an equivalent return of 320% for the S&P World Ex-U.S. Index.

We’ve noted previously that concentration trends can manifest at a country level. As a result of its outperformance, the weight of the U.S. component of our S&P World Index has risen accordingly from roughly 50% in 2009 to over 70% currently. Meanwhile, the U.S. dollar has strengthened in tandem, as illustrated by Exhibit 2, which may create potential headwinds for large-cap multinational companies that tend to have more overseas revenue exposures and tailwinds for smaller, more domestically sensitive stocks.

Turning our attention across the capitalization spectrum, the outperformance of U.S. equities broadened beyond large caps during the second half of the year, thanks to additional catalysts beyond dollar strength, including Fed rate cuts and post-election enthusiasm for potential impending tariff policies that may benefit smaller caps. Although mega caps have returned to favor so far in December, the S&P MidCap 400® and the S&P SmallCap 600® have outperformed the S&P 500 by 2.6% and 5.2%, respectively, since July 9, a key turning point for U.S. markets, as investors began to shift away from the Magnificent 7 and other mega caps toward smaller companies.

In addition to their stellar outperformance, U.S. equities are interesting to analyze for their diversification potential. In Exhibit 4, we calculate the spread in trailing 12-month volatility between the S&P World Index and S&P World Ex-U.S. Index. When this spread is positive, the inclusion of the U.S. increases volatility in the benchmark; when negative, the country acts as a diversifier. The negative spread that has occurred so far this year is an indication that the U.S. has become a volatility diversifier,1 consistent with the divergent performance observed earlier.

As we look ahead to 2025, while we do not know whether the U.S. market rally will be sustained or if smaller caps will maintain their momentum, we can acknowledge that if the outperformance of the U.S. compared to the rest of the world continues, the associated diversification properties may have important consequences for asset owners globally.


1We do acknowledge that the U.S. makes up more than 70% of the weight in the S&P World Index, but caveat that the U.S. component includes exposure to large multinational companies that have a diverse revenue base across geographies.

The posts on this blog are opinions, not advice. Please read our Disclaimers.