


How is a GARP strategy different from a traditional growth or value strategy? S&P DJI’s Jason Ye sits down with Andrew Geoghegan from Ausbiz to unpack the growth at a reasonable price approach and explore its relevance to market participants in Australia.
The posts on this blog are opinions, not advice. Please read our Disclaimers.Understanding GARP Strategies
Profitability Matters in Canadian Small Caps
Exploring the Index Liquidity Landscape
Sector Neutrality – An Essential Mechanism within the S&P 500 ESG Leaders Index
The Taxing Effect of Taxes
Understanding GARP Strategies
Profitability Matters in Canadian Small Caps

As the S&P/TSX SmallCap Select Index celebrates its fifth anniversary, it’s an opportune time to reflect on the index’s performance, construction and composition compared to the benchmark S&P/TSX SmallCap Index. With a five-year live track record, the select index has demonstrated its ability to measure the Canadian small-cap segment with higher total returns and lower volatility.
Understanding the S&P/TSX SmallCap Select Index
The S&P/TSX SmallCap Select Index employs the same methodological framework as our existing S&P Global SmallCap Select Index Series, but it utilizes the S&P/TSX SmallCap Index as its selection universe. To qualify for inclusion, companies must achieve two consecutive years of positive earnings per share. As a safeguard, companies that report two consecutive years of negative earnings are removed from the index. To enhance replicability, we also exclude the smallest 20% and the least liquid 20% of companies. The index is weighted by float market capitalization and is rebalanced semiannually in June and December.

As of Oct. 31, 2024, the S&P/TSX SmallCap Select Index included 135 of 243 S&P/TSX SmallCap Index constituents, representing 66% coverage by index weight. As illustrated in Exhibit 2, the S&P/TSX SmallCap Select Index showed a higher average median daily value traded (MDVT), representing enhanced liquidity. By focusing on a smaller subset, the select index eliminates less actively traded stocks. This targeted approach emphasizes securities with higher turnover and size, potentially translating to increased capacity and replicability compared to the benchmark index.

Long-Term Track Record of Outperformance
Over the past twenty years, the S&P/TSX SmallCap Select Index outperformed the benchmark S&P/TSX SmallCap Index by approximately 2% per year with lower volatility. The S&P/TSX SmallCap Select Index rebounded more quickly during periods of extreme volatility compared to its benchmark, possibly thanks to its emphasis on liquidity and financial stability. This trend is particularly evident during times of market stress, such as the COVID-19 pandemic and its aftermath, when smaller, less liquid companies typically faced larger losses than their more stable peers.

The S&P/TSX SmallCap Select Index has outperformed the benchmark during several periods, as shown in Exhibit 4. The index also experienced lower volatility, as reflected by its lower standard deviation, indicating more consistent returns and reduced exposure to the sharper price fluctuations that were seen in the broader S&P/TSX SmallCap Index.

The S&P/TSX SmallCap Select Index has shown strong performance relative to the benchmark, with a hit rate of 69.2% during down months, suggesting its resilience in volatile markets. The lower down-market capture ratio indicates that the index was less affected by the market’s downside, providing additional stability during the market decline.

In conclusion, the S&P/TSX SmallCap Select Index demonstrates that a more targeted approach that excludes companies deemed less profitable along with the smallest and least liquid securities has historically improved long-term total returns, reduced risk and enhanced liquidity compared to the broader Canadian small-cap segment.
The posts on this blog are opinions, not advice. Please read our Disclaimers.Exploring the Index Liquidity Landscape
How can the trading ecosystems surrounding indices help to foster transparency and market efficiency? S&P DJI’s Joe Nelesen and Tim Edwards explore why index liquidity matters and how the ecosystems of products tracking S&P DJI indices have evolved across equities and fixed income.
The posts on this blog are opinions, not advice. Please read our Disclaimers.Sector Neutrality – An Essential Mechanism within the S&P 500 ESG Leaders Index

The S&P 500® ESG Leaders Index seeks to provide a measurement of U.S. equities while incorporating ESG (Environment, Social, and Governance) factors.1 The index maintains similar industry weights to the S&P 500 while implementing stricter ESG eligibility criteria.
A common misconception is that all ESG indices remove or underweight sectors deemed environmentally damaging, such as Energy or Utilities. However, removing entire sectors may result in a shift in weight toward other sectors, potentially creating sector bias and concentration risk. Rather than excluding sectors, the S&P 500 ESG Leaders Index selects companies that perform highest when considering specific ESG metrics.
Exhibit 1 illustrates how the S&P 500 ESG Leaders Index maintains low active share in relation to the benchmark index, in each sector, with the sector active share at 6.41%, highlighting broad sector neutrality. However, using ESG metrics as the criteria to determine index inclusion will naturally result in deviations from the underlying index. This is particularly evident when a sector has several constituents deemed ineligible or a company with a high float market cap (FMC) is excluded. Typically, the more a methodology integrates stricter sustainability criteria, the greater the active share.
The S&P 500 ESG Leaders Index methodology selects constituents on a relative basis1 within each GICS® industry group, resulting in low active share within sectors. However, in certain instances, sectors may be over- or underweighted relative to the underlying index, causing deviation. This is illustrated by the active share at the index level reaching 41.15%, which is driven by both disparity in index constituents with the S&P 500, as mentioned previously, as well as weights (see Exhibit 1).

The index selection process targets 50% of uncapped FMC from each GICS industry group in the S&P 500, selecting companies in decreasing order using S&P Global ESG Scores (see Exhibit 2). However, specific exclusions (such as exclusions based on specified business activities) may prevent an industry group from meeting the 50% target. This could be a result of the industry lacking enough eligible constituents or the FMC weight of eligible constituent weights not reaching the target.

If this happens, excess industry weight is distributed proportionately among the remaining index constituents. If eligible constituents with higher FMC weighting are selected, any additional weight allocation may result in a sector overweight (see Exhibit 3). To prevent single-stock concentration, a constituent cap1 is integrated as per the S&P 500 ESG Leaders Indices methodology.

The S&P 500 ESG Leaders Index has provided a measurement of U.S. equities with an ESG lens and maintained similar industry group weights as the S&P 500. By utilizing index construction to maintain broad sector neutrality, the index historically reduced the impact of sector-driven performance, increased the impact of stock selection and produced low tracking error versus the S&P 500.3 Consequently, the success of the index is not solely measured through its performance but also by how closely its industry group weights—and, by extension, sector weights— remain similar to the S&P 500.
1 See Rowton, Stephanie and Maria Sanchez, “The S&P 500 ESG Index: 5 Years of Defining Core Through an ESG Lens,” S&P Dow Jones Indices LLC, Aug. 7, 2024.
2 A maximum single-company weight cap (5%, company weight in the S&P 500 ESG Index) is applied to the final index constituents.
3 Beyhan, Maya, “Understanding the Outperformance of the S&P 500 ESG Leaders Index through a Sectoral Lens,” S&P Dow Jones Indices’ Indexology® Blog, Oct. 24, 2024.
The posts on this blog are opinions, not advice. Please read our Disclaimers.The Taxing Effect of Taxes

“Be thankful I don’t take it all, cause I’m the taxman.”
George Harrison (The Beatles) in “Taxman”
For over 20 years, S&P Dow Jones Indices has compared index performance against actively managed funds and published the results in the SPIVA® Scorecards. Active funds have often struggled to match the returns of capitalization-weighted benchmarks like the S&P 500® or the S&P Composite 1500® (see the SPIVA Global Mid-Year 2024). But even outperforming active managers have faced headwinds, including typically higher fees and particularly taxes, which can significantly erode performance, leaving even fewer managers capable of outperforming in the long run.
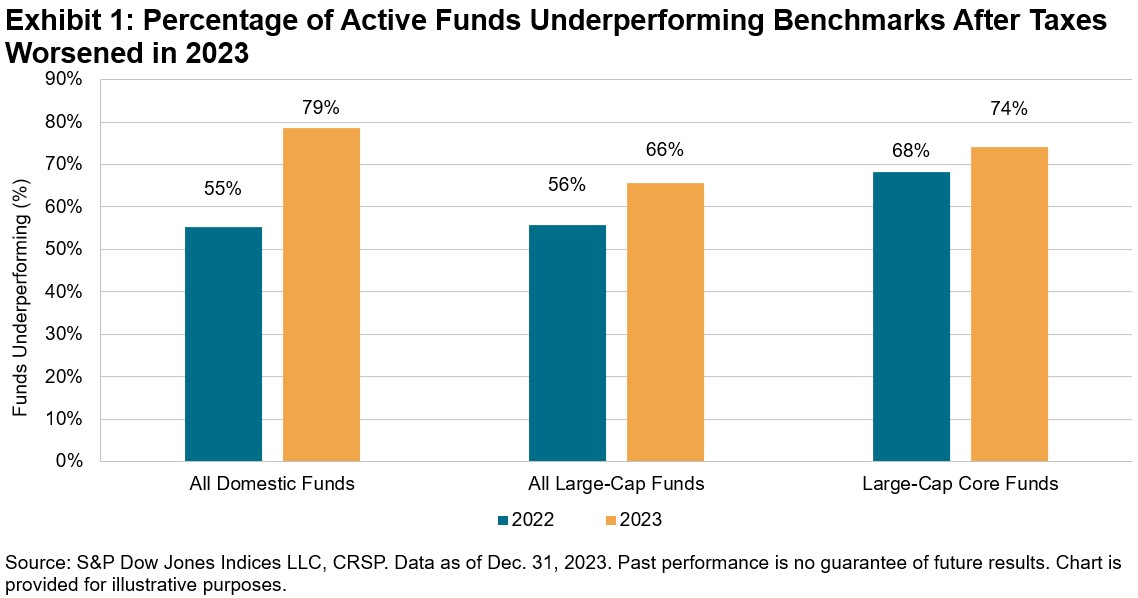
The SPIVA After-Tax Year-End 2023 Scorecard analyzes the cumulative effect of taxes on investor returns for broad U.S. domestic equity categories, demonstrating the improbability of beating a benchmark after accounting for taxes on capital gains and other distributions. In 2023, across the All Domestic Funds, All Large-Cap Funds and Large-Cap Core Funds categories, 79%, 66% and 74% of active managers underperformed their benchmarks after taxes, respectively. Fund manager underperformance rates worsened considerably compared to 2022, particularly for All Domestic Funds (see Exhibit 1).
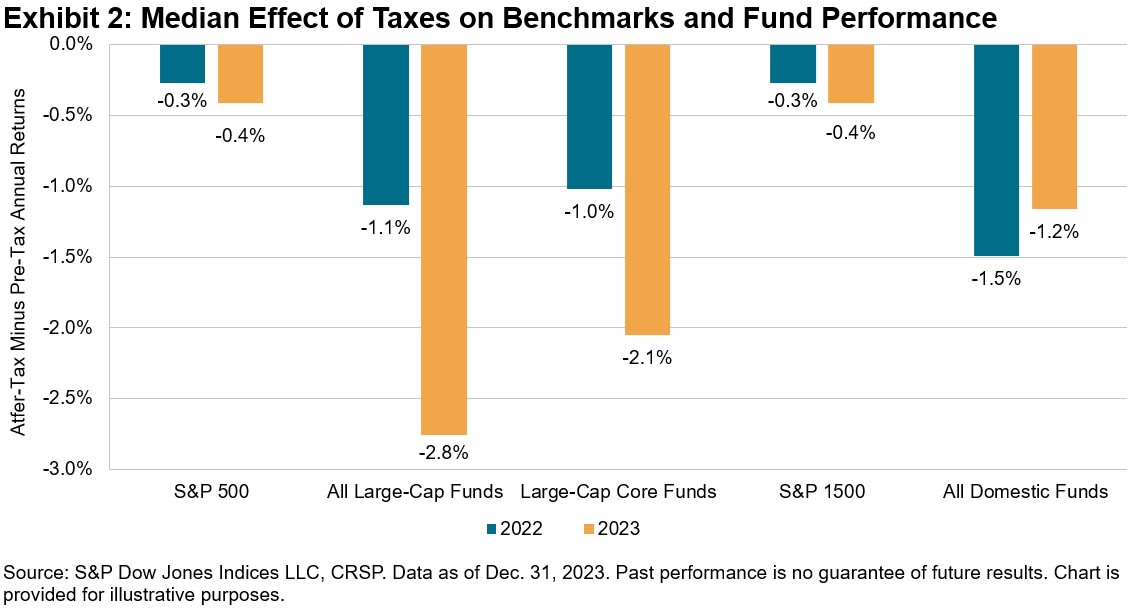
A key reason for the higher underperformance rates in 2023 is that the impact of taxes on the returns of active funds was generally greater compared to the equivalent tax impact on the respective benchmarks. The 2023 median after-tax returns for All Domestic Funds, All Large-Cap Funds and Large-Cap Core Funds lagged their pre-tax medians by 1.2%, 2.8% and 2.1%, respectively, compared to 1.5%, 1.1% and 1.0%, respectively, in 2022. These differentials were considerably larger compared to the less than 0.5% impact for both the benchmark S&P 1500® and S&P 500.
If the impacts of taxation on actively managed funds weren’t damaging enough, the sharp increase in long-term mutual fund outflows over the past couple years may have led to another unfortunate scenario for taxable investors. During 2022 and 2023, long-term U.S. mutual funds experienced a combined USD 1.765 trillion in net outflows.1 These persistent outflows may have triggered tax bills for investors even in strong-performing markets.
While 2023 was a much different market regime than 2022 (characterized by a sharp rise of 26.3% and a severe downturn of 18.1%, respectively, for the S&P 500), one thing was the same in both years: active managers in broad U.S. equity categories found it difficult to beat their benchmarks, particularly when tax bills came due. To learn more about the effect of taxes on fund performance, please see the SPIVA After-Tax Year-End 2023 Scorecard.
The author would like to thank Joe Nelesen, Davide Di Gioia and Grace Stoddart for their contributions to this post.
1 For more detail on long-term U.S. mutual fund flows, please see figures 3.3 and 3.4 (pages 46-48) in the 2024 Investment Company Fact Book.
The posts on this blog are opinions, not advice. Please read our Disclaimers.