Get Indexology® Blog updates via email.

In This List

SPIVA Europe Scorecard 2022: A Challenging Year for Fixed Income, but Not Necessarily for All Fixed Income Managers

A Fast Start to 2023 for the S&P China 500 – Returning 5.0% in Q1

SPIVA and the Challenges of Active Outperformance

Breakfast – The Most Important Meal of the Day

Results from the Recent S&P 500 Net Zero 2050 Paris-Aligned Sustainability Screened Index Rebalance (March 2023)

SPIVA Europe Scorecard 2022: A Challenging Year for Fixed Income, but Not Necessarily for All Fixed Income Managers

Contributor Image
Anu Ganti

U.S. Head of Index Investment Strategy

S&P Dow Jones Indices

For the first time, our SPIVA® Europe Year-End 2022 Scorecard measures the performance of actively managed fixed income funds, covering 11 categories across currencies and credit quality. Fixed income funds had a better record than their equity brethren in 2022, with a majority of funds outperforming in five reported categories over a one-year horizon (compared to none of our 22 equity categories). At the front of the pack, just 23% of euro-denominated government bond funds underperformed the iBoxx Euro Sovereigns  in 2022. Admittedly, the results were less impressive as the time horizon extended: a cross-category average of 84% of active fixed income funds underperformed their assigned benchmark over the 10-year period, including 88% of euro-denominated government bond funds.

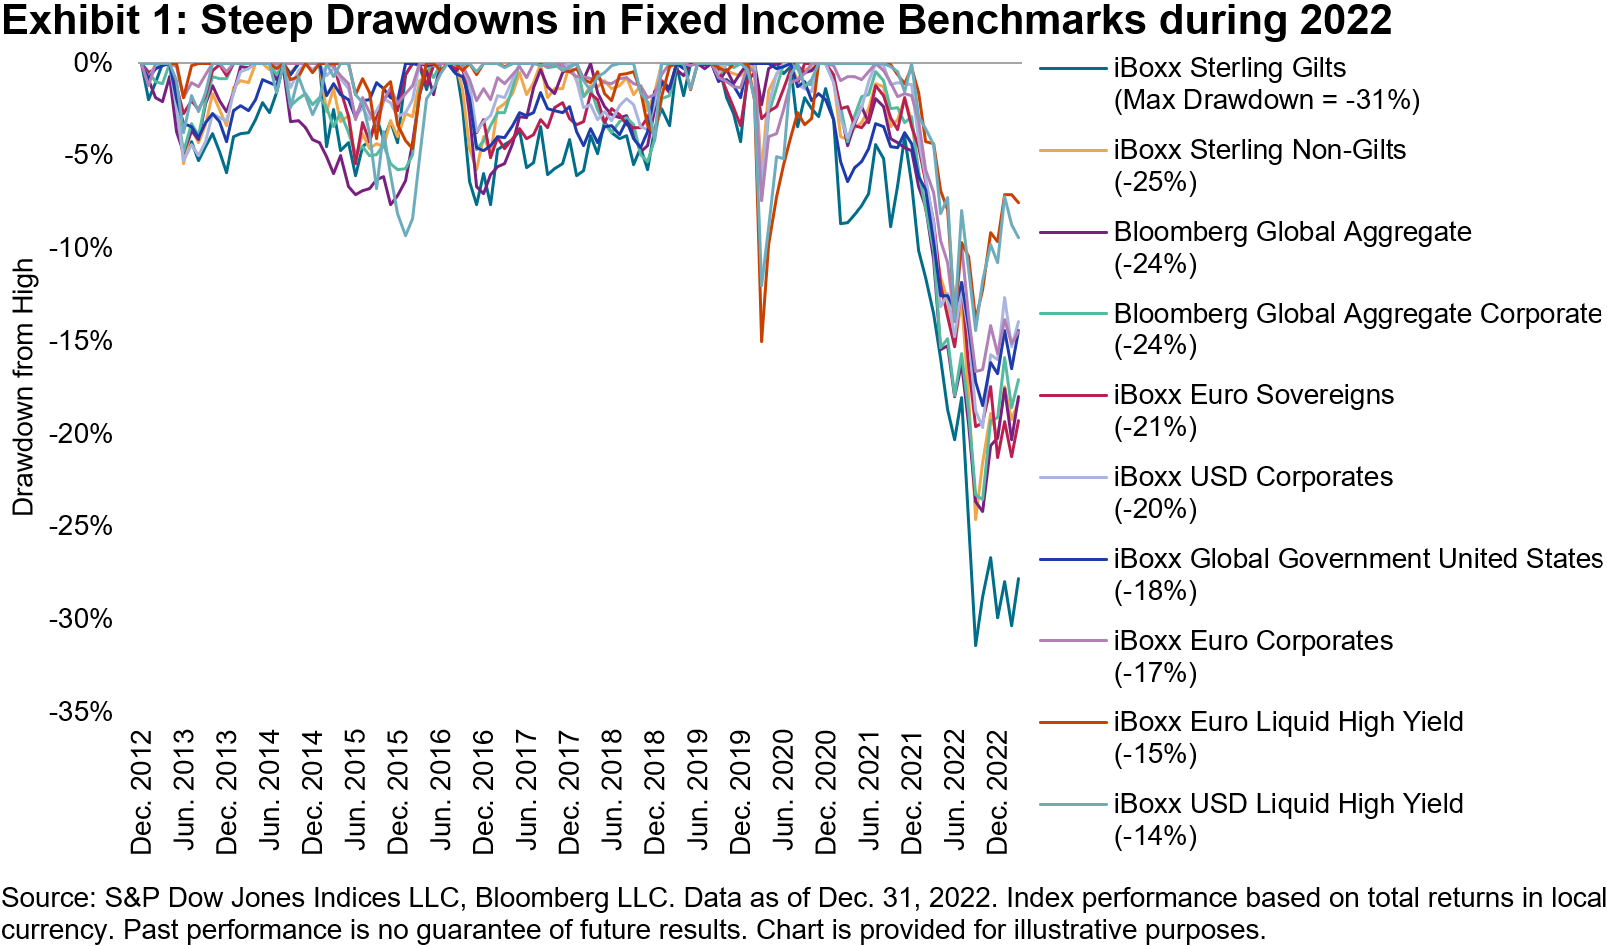
To say that 2022 was a challenging year for bonds globally is an understatement. Central banks around the world tightened interest rates to combat inflation, leading to double-digit losses for most European fixed income benchmarks, accompanied by particularly large declines in longer-dated bonds, which are more sensitive to changes in interest rates. Exhibit 1 shows the extent of 2022’s declines in our fixed income benchmarks in a decade-long historical context. At the back of the pack, the iBoxx Sterling Gilts recorded a maximum drawdown equal to a 31% decline from its 2020 high, finishing the year not far from its lows.

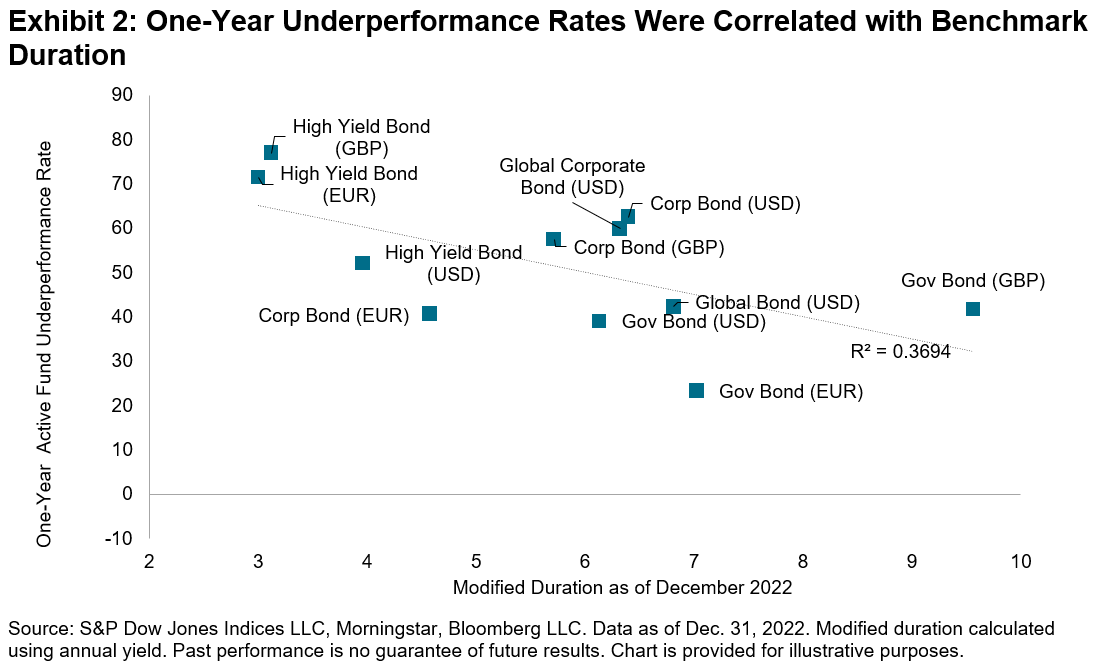
Despite the carnage, there were a few bright spots for actively managed funds, particularly in categories with benchmarks that were more sensitive to changes in the yield environment. Exhibit 2 plots the relationship between the one-year active underperformance rate in each fixed income category and rate sensitivity in that category’s benchmark, as measured by modified duration. The two series are negatively correlated, which suggests that some active managers may have generated their relative outperformance by holding bonds with shorter maturities, on average, than their category benchmark.

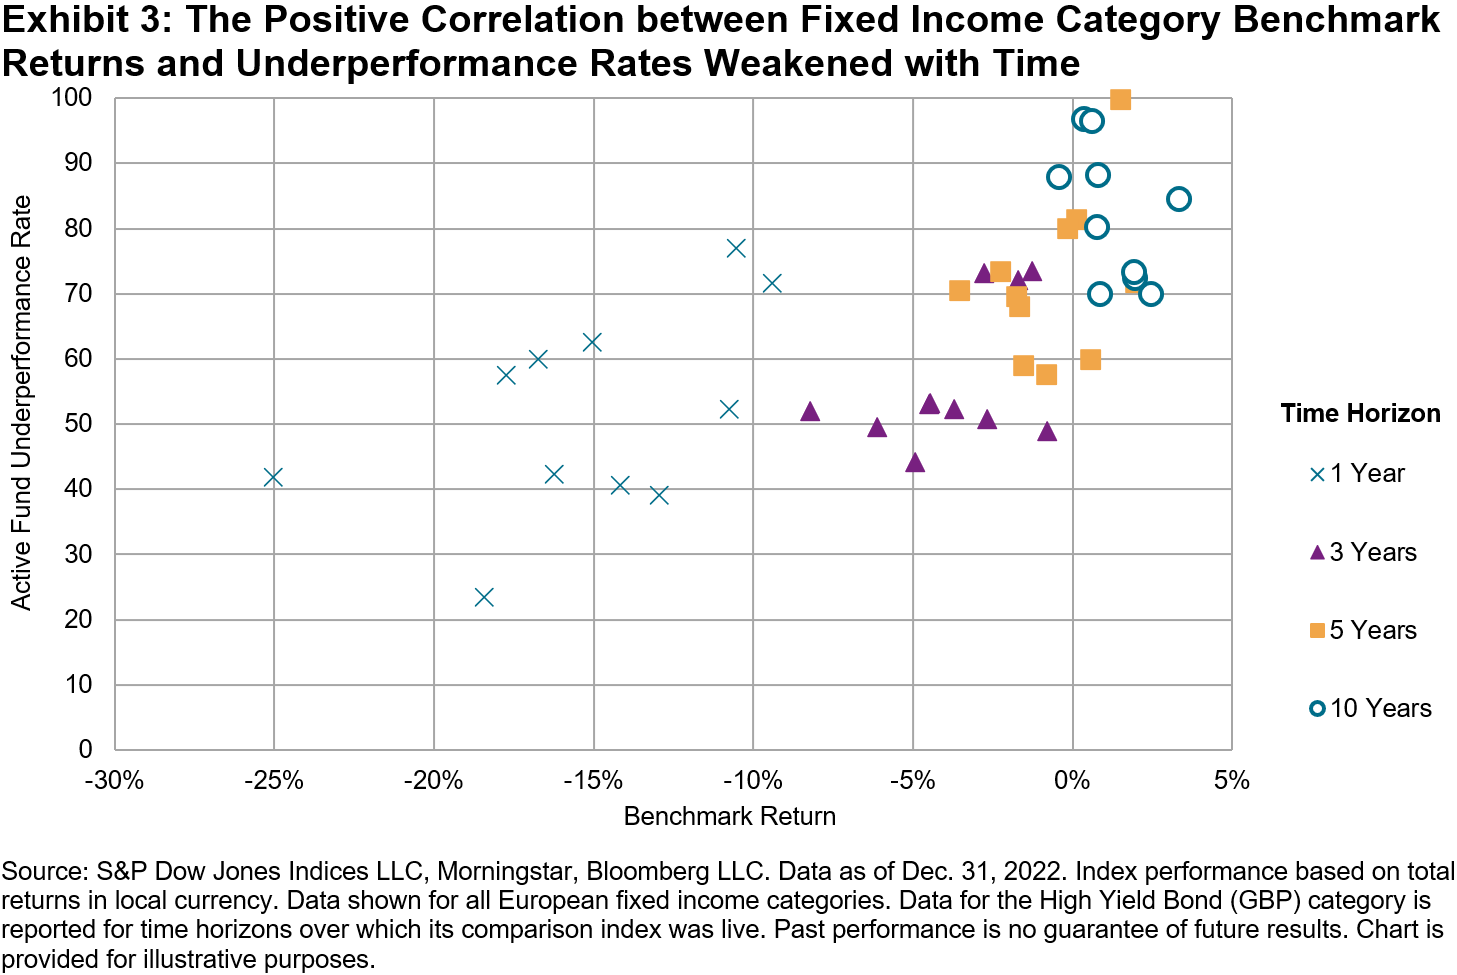
While conditions were particularly auspicious for fixed income managers with poorly performing benchmarks in 2022, such tailwinds may not persist over the long-term. Exhibit 3 shows that the relationship between benchmark returns and underperformance rates progressively weakens as the time horizon extends to 3, 5, and then 10 years. Just as Tim Edwards observes within European equities, the evidence suggests that is no easy task to identify active fixed income managers who can beat benchmarks over the long term.


The posts on this blog are opinions, not advice. Please read our Disclaimers.

A Fast Start to 2023 for the S&P China 500 – Returning 5.0% in Q1

Contributor Image
Sean Freer

Director, Global Equity Indices

S&P Dow Jones Indices

The S&P China 500 gained 5.0% in Q1 2023, continuing to claw back some of the losses exhibited in 2022. Developed markets broadly had a strong quarter, with Chinese equities underperforming global equities while outperforming emerging markets. Communication Services led sector performance for the start of 2023, up over 20%. Energy and Information Technology also had a strong quarter, contributing to positive returns.

There was a large return dispersion among Asian markets in Q1. The S&P Korea BMI and S&P Taiwan BMI were the strongest markets, posting returns of 13.3% and 13.2%, respectively. The S&P China 500 outperformed the S&P Hong Kong BMI and S&P India BMI, which retracted 2.4% and 5.5%, respectively.

The S&P China 500 continued to maintain positive performance over the long term. With annualized gains of 5.9% in USD terms over the 10-year period ending in March 2023, the index has easily outperformed the S&P Emerging BMI, which gained only 2.9% per year over the same period.

Onshore Stocks Outperformed Offshore

The distinctive sector composition of offshore and domestic China listing types can sometimes result in performance variances. However, both delivered positive returns during the quarter, with China A-Shares outperforming China H-Shares. The S&P China 500 is diversified with both onshore and offshore listings and thus outperformed indices with higher weights in Hong Kong-listed Chinese companies.

Communication Services and Information Technology Led the Gains

Communication Services and Information Technology companies led performance in Q1 2023, gaining 20.6% and 17.0%, respectively. Energy also had a strong quarter, up 14.4%. Real Estate was the largest drag on the S&P China 500 performance, as it declined by 5.1%. All other sectors delivered a positive return during the quarter.

At the company level, the largest contributor to index return during the quarter was Tencent, which was up 20.9%, continuing the positive momentum from Q4 2022. Alibaba was also a notable contributor, up over 10%, and Kweichow Moutai had a solid quarter as well. In terms of standout performers, 360 Security Technology Inc, Zhongji Innolight and Zhejiang Dahua Technology each gained over 100% during the quarter. A number of technology stocks have outperformed amid investor enthusiasm over the commercialization potential of generative AI products.

Meituan (down 18.3%), JD.com Inc (down 21.8%) and PDD Holdings (down 6.9%) were among the few noteworthy relative detractors to index return during the quarter.

Valuation Metrics Remain Attractive

The S&P China 500 trailing P/E increased to 14.3x in Q1 2023 (14.1x in the prior quarter); however, it remained below the 3-, 5- and 10-year average. The rolling 1-, 3- and 5-year P/E ratios remained slightly above the longer-term average.

The trailing P/E for the S&P Emerging BMI also increased to 13.5x, as security price gains outweighed the losses across emerging markets. The S&P China 500 dividend yield, meanwhile, decreased from 2.44% to 2.34% on a quarterly basis.

The posts on this blog are opinions, not advice. Please read our Disclaimers.

SPIVA and the Challenges of Active Outperformance

What are the three main reasons it’s hard for most active managers to beat their benchmarks? Explore findings from the SPIVA and Persistence Scorecards with S&P DJI’s Craig Lazzara including an allegorical look at what might happen if Craig challenged Michael Jordan to a free-throw shooting contest.

The posts on this blog are opinions, not advice. Please read our Disclaimers.

Breakfast – The Most Important Meal of the Day

Contributor Image
Jim Wiederhold

Former Director, Commodities and Real Assets

S&P Dow Jones Indices

The first quarter of 2023 was a slow start to the year for commodities in general. The S&P GSCI Dynamic Roll Breakfast (OJ 5% Capped) also had a slow start, down 3.1%, after a solid 2022 performance of 14.12%. Maybe a higher weight to coffee would give the index the caffeine kick needed to boost performance—the S&P GSCI Coffee was up 5.8% for Q1 2023, as rising temperatures in the tropics lead to lower crop yields in the coffee-growing regions around the world. However, we would not be able to change the weightings of our breakfast index on a whim because it is based on world production of each of the six commodities making up the index.

The world’s food supply may continue to experience perilous geopolitical-based events like the Russia-Ukraine conflict, directly affecting nations who are some of the largest exporters of key grains, leading to price spikes like was seen last year with wheat. Other key agriculture-exporting regions are experiencing rising political instability, especially in some South American and North African countries.

While supply chain issues have mostly been resolved, the costs of production and transport will likely rise over time as every industry encounters scrutiny over carbon emissions. Major commodity producers regularly announce new plans to lower their carbon footprint, which will come at a higher cost but is needed to help combat climate change.

Compared to the headline benchmark S&P GSCI, breakfast commodities performed in a much less volatile manner over the last 20 years, as can be seen in Exhibit 2. The main reason is due to the lack of more volatile energy commodities that are included in the S&P GSCI. Unless gasoline is added to your morning coffee, breakfast tended to be a much smoother start to your day over the years, although there have been periods of much higher volatility for some of the individual breakfast commodities.

The S&P GSCI Dynamic Roll Breakfast (OJ 5% Capped) provides market participants with a new thematic way to look at commodities and offers a benchmark to key themes of food security against the backdrop of a rising global population. For more information on our commodities indices, please visit our website.

The posts on this blog are opinions, not advice. Please read our Disclaimers.

Results from the Recent S&P 500 Net Zero 2050 Paris-Aligned Sustainability Screened Index Rebalance (March 2023)

Contributor Image
Narottama Bowden

Director, Sustainability Indices Product Management

S&P Dow Jones Indices

Narottama Bowden,

The author would like to thank Clara Arganaraz, Index Manager of the S&P 500® Net Zero 2050 Paris-Aligned Sustainability Screened Index, for her contributions to this post.

S&P Dow Jones Indices recently completed the rebalancing of all indices that aim to meet the minimum requirements for EU Climate Transition and EU Paris-Aligned Benchmarks.1 This includes the rebalancing of the S&P 500 Net Zero 2050 Paris-Aligned Sustainability Screened Index, which is designed to measure the performance of eligible equity securities from the S&P 500, selected and weighted to be collectively compatible with a 1.5ºC global warming climate scenario at the index level, among other climate, environmental and sustainability objectives.

The index is designed to achieve a variety of ESG objectives through the use of sustainability screening in its eligibility criteria and an optimization process in constituent selection and weighting, including a reduced overall greenhouse gas (GHG; expressed in CO2 equivalents) emissions intensity compared to its underlying index (the S&P 500) by at least 50%. It also has a minimum self-decarbonization rate of GHG emissions intensity in accordance with the associated trajectory implied by the Intergovernmental Panel on Climate Change’s (IPCC) most ambitious 1.5ºC scenario, equating to at least a 7% GHG intensity reduction on average per year.

As of the index’s Feb. 28, 2023, rebalancing reference date (and all previous rebalances), the index’s enterprise value including cash (EVIC) inflation-adjusted weighted-average carbon intensity (WACI)2 achieved its required level of decarbonization—the minimum of either half the S&P 500 WACI or its 7% self-decarbonization trajectory WACI as at the rebalance reference date. The index achieved a relative decarbonization to the underlying index of 59.10% at an EVIC inflation-adjusted WACI at the required level (102.78).

The index seeks to achieve a variety of other objectives simultaneously, and once more, was able to achieve them successfully at the recent rebalance.

  • The index’s weighted-average 1.5˚C Climate Transition Pathway Budget Alignment4 was zero, implying the index is 1.5˚C Climate Scenario-aligned at the index level.5
  • The index’s weighted-average S&P DJI Environmental Score achieved the minimum level required at this rebalance (72.42) based on this constraint in the methodology, also exceeding the score of the underlying index (65.61).
  • The index’s high climate impact sectors revenues exposure was at least as high as in the underlying index, as required by the minimum standards for EU Climate Transition Benchmarks and EU Paris-aligned Benchmarks.
  • The index had a lower exposure to companies deemed to insufficiently disclose their GHG emissions, at a level well below its maximum exposure permitted by the methodology.
  • The index did not have any exposure to companies with fossil fuel reserves, despite the methodology permitting a maximum of 20% of the exposure of the underlying universe.
  • The index-level physical risk score (31.37) was below the required level as of the rebalance (31.52), as defined by the methodology, and it was lower than the underlying index’s score (35.02).6
  • The index’s ratio of green revenues to brown revenues was four times higher than in the underlying index, as required by the methodology.

The S&P 500 Net Zero 2050 Paris-Aligned Sustainability Screened Index seeks to achieve a range of climate change, environmental and sustainability objectives, and again the index has met these ambitions.


1 Commission Delegated Regulation (EU) 2020/1818 of 17 July 2020 supplementing Regulation (EU) 2016/1011 of the European Parliament and of the Council as regards minimum standards for EU Climate Transition Benchmarks and EU Paris-aligned Benchmarks. https://eur-lex.europa.eu/legal-content/EN/TXT/PDF/?uri=CELEX:32020R1818&from=EN

2 Measures are calculated in metric tons of carbon dioxide-equivalent emissions per USD 1 million of EVIC (tCO2e/USDmn). For more information on how this metric is calculated, see “Weighted-Average Carbon Intensity (WACI)” in the Constraint-related Definitions section of the S&P 500 Net Zero 2050 Paris-Aligned Sustainability Screened Index Methodology.

3 For more information on how the WACI is adjusted for EVIC inflation, see “Inflation Adjustment” in Section 3, Part 4 of the EU Required ESG Disclosures Appendix in the S&P Paris-Aligned & Climate Transition Index Family Benchmark Statement

4 For more information on how this metric is calculated, see the Constraint-related Definitions and Optimization Constraints sections of the S&P 500 Net Zero 2050 Paris-Aligned Sustainability Screened Index Methodology, and the S&P Dow Jones Indices: ESG Metrics Reference Guide.

5 A measure at or below zero means the index is 1.5˚C Climate Scenario-aligned at the index level.

6 A lower score is associated with less physical risk exposure at the index level.


The posts on this blog are opinions, not advice. Please read our Disclaimers.