Get Indexology® Blog updates via email.

In This List

SPIVA Japan Scorecard 2022: Active Underperformance Despite an Abundance of Opportunities

Examining Passive Performance at the Core

Diversification and Performance: Potential Applications of U.S. Equities in Japan

The “Devil’s Metal” Vanishes, Precious Metals Shine and Energy Dims: Commodities Quarterly Wrap

Minor Impact to Headline S&P/ASX Indices from GICS Changes

SPIVA Japan Scorecard 2022: Active Underperformance Despite an Abundance of Opportunities

Contributor Image
Maya Beyhan

Senior Director, ESG Specialist, Index Investment Strategy

S&P Dow Jones Indices

The inaugural S&P Indices versus Active (SPIVA®) U.S. Scorecard was published in 2002, and has since been extended to Australia, Canada, Europe, India, Japan, Latin America, South Africa and the Middle East & North Africa (MENA), allowing investors to experience the active versus passive debate on a global scale.

The SPIVA Japan Scorecard measures the performance of actively managed funds domiciled in Japan against their respective S&P DJI comparison benchmarks over various time horizons, covering large-, mid- and small-cap, as well as international and global equity funds.

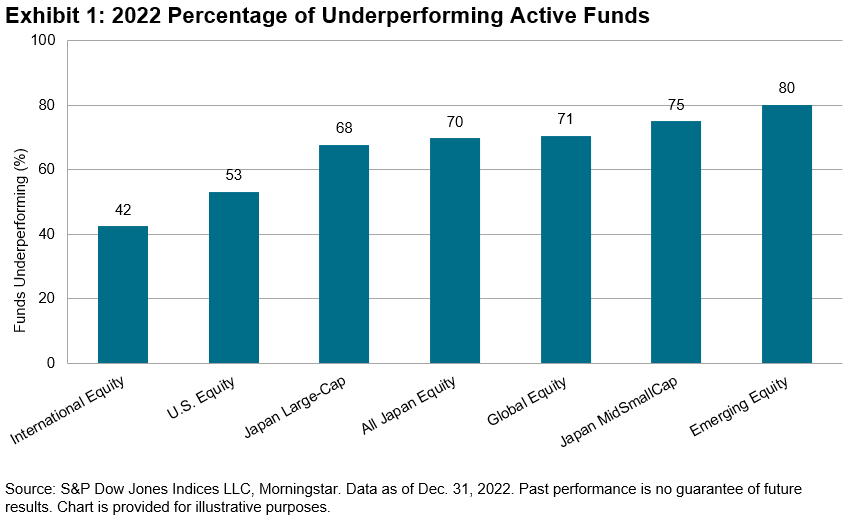
According to the recently published SPIVA Japan Year-End 2022 Scorecard, 70% of All Japanese Equity funds underperformed the broad-based S&P Japan 500 over the full-year 2022, and more than half of equity funds underperformed their benchmarks in every reported category, except for International Equity funds, which had an underperformance rate of 42% (see Exhibit 1).

Several aspects of the market environment in 2022 stood out as potentially indicative of a favorable environment for active managers in Japanese equities over the period. For example, the largest companies (as represented by the S&P/TOPIX 150) had lower returns than small- and mid-sized Japanese companies (as represented by the S&P Japan MidSmallCap; see Exhibit 2). This potentially created a tailwind for active managers, as funds are typically less likely to own all the largest stocks at market weight.

Second, opportunities for outperformance through stock selection were plenty in 2022. At the benchmark level, dispersion is the measure of the degree to which securities differ—above or below—the average performance.1 As illustrated in Exhibit 3, the average monthly annualized dispersion in the securities of the scorecard comparison indices was higher in 2022 than was typical over the past 10 years.

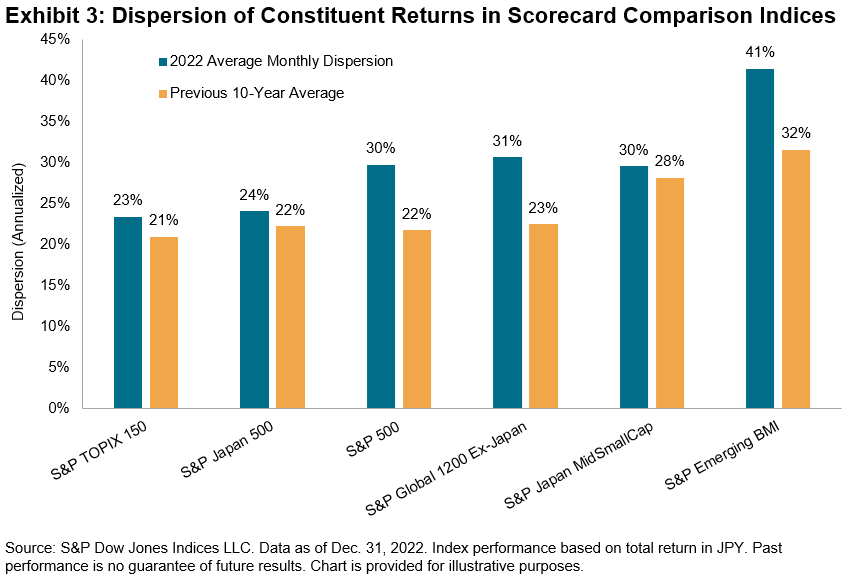
Due to the costs associated with running any portfolio, an actively managed fund may still underperform even if it picks outperforming securities. For an active manager, the key is to find not just securities that outperform, but those that outperform materially. At times when most securities perform similarly, differentiation is surely harder to find. Then, there are other times when the difference between winners and losers is larger.

Taken all together, the data in the SPIVA Japan Year-End 2022 Scorecard suggest that among the active funds offered in Japan, International Equity managers were relatively more successful in turning opportunities into positive outcomes. However, active funds in all the other fund categories struggled to take advantage of the abundance of opportunity presented in 2022’s market environment.


1 For example, see Edwards, Tim and Craig J. Lazzara, “Dispersion: Measuring Market Opportunity,” S&P Dow Jones Indices, 2014.

The posts on this blog are opinions, not advice. Please read our Disclaimers.

Examining Passive Performance at the Core

How does indexing work for large-cap equities? S&P DJI’s Hamish Preston and State Street Global Advisor’s Michael Arone take a closer look at lessons from 20 years of SPIVA, including fee savings, outperformance, and what the latest GICS® changes mean for sectors and industries moving forward.

The posts on this blog are opinions, not advice. Please read our Disclaimers.

Diversification and Performance: Potential Applications of U.S. Equities in Japan

Contributor Image
Cristopher Anguiano

Senior Analyst, U.S. Equity Indices

S&P Dow Jones Indices

The U.S. equity market is by far the largest in the world, representing 57.7% of the global market capitalization, and it is nearly nine times the size of the Japanese equity market (see Exhibit 1). Hence, Japanese investors may wish to consider U.S. equities in order to not overlook a significant portion of the global opportunity set.

The S&P 1500™ is designed to measure the performance of the U.S. equity market and its construction helps it avoid less liquid, low priced and lower quality stocks. The index combines the S&P 500®, S&P MidCap 400® and S&P SmallCap 600® and captures over 90% of the U.S. equity market capitalization. Although smaller U.S. equity segments may seem less relevant to international investors, the breadth and depth of the U.S. equity market means that mid- and small-cap U.S. equities represent a significant portion of the global market and are larger than some regional markets.

The U.S. equity market has distinct sector exposures, so one potential benefit of incorporating U.S. equities is that they can help to alleviate domestic sector biases. For example, Exhibit 2 shows the GICS® sector weights of the Japanese equity market—as represented by the S&P Japan 500—and its relative sector weights versus the S&P 1500. Adding U.S. equities can help redistribute sector weights toward the I.T., Health Care and Energy sectors, while also decreasing the concentration to Industrials, Consumer Discretionary and other sectors.

The historical performance of U.S. equities may offer another potential reason for Japanese investors to consider U.S. equities. Exhibit 3 shows that the U.S. equity indices have outperformed the Japanese equity indices since 1994. The S&P 1500 slightly outperformed the S&P 500 due to its exposure to mid and small caps.

Exhibit 4 depicts the long-term risk/return tradeoff for several hypothetical portfolios combining the S&P Japan 500 and S&P 1500 in JPY. The chart shows that increasing allocation to the S&P 1500 provided better performance than purely local strategies, historically.

From its representation of a significant portion of the global opportunity set, to potential sector diversification benefits and historical performance improvements, U.S. equities may be worth consideration for Japanese market participants.

The posts on this blog are opinions, not advice. Please read our Disclaimers.

The “Devil’s Metal” Vanishes, Precious Metals Shine and Energy Dims: Commodities Quarterly Wrap

Contributor Image
Brian Luke

Senior Director, Head of Commodities, Real & Digital Assets

S&P Dow Jones Indices

“Jamie ran on down to the LME, but the devil caught him there,

He took Mr. Dimon’s Nickel bags and vanished in the air,

Set out running but I’ll take my time,

A friend of the devil is a friend of mine”

-adaptation of Grateful Dead’s “Friend of the Devil”

Just one year after the London Metal Exchange (LME) nickel market broke down, the “devil’s metal” found itself back in the headlines. This time around, the LME reported that 54 metric tons, worth about USD 1.3 million, of nickel turned out to be bags of stones.1 J. P. Morgan was revealed to be the registered owner tied to contracts slated for physical delivery, and the S&P GSCI Nickel registered a 20.54% decline for Q1 2023. Nickel represents more than a third of the S&P GSCI Electric Vehicle Metals Index and the component’s performance has dragged the overall index into bear market territory, with a one-year return of -24.73%.

Commodity-based inflation readings (including food and energy) experienced record drops in the eurozone. That didn’t stop silver and gold from rebounding nicely on the month, as the non-commodity inflation indicators, or core measures, continued to give credence to central banks focused on bringing price increases down to a simmer. The S&P GSCI Silver and S&P GSCI Gold rallied total returns of 15.11% and 7.61%, respectively.

Widening out to the broad commodities market, the world’s leading commodities benchmark, the S&P GSCI, lagged stock and bond indices, falling 1.07%. Meanwhile, the S&P GSCI Energy fell 3.49% for the month, and oil futures continued to show discounts out the forward curve, supporting expectations that supply constraints will abate. Output of nearly half a million barrels of oil, or 5% of global production per day, was cut by a court ruling in favor of the Iraqi government. Iraq successfully argued that Turkey violated prior agreements by importing oil from the Kurdistan Regional Government.

The worst-performing segment of the S&P GSCI was natural gas, dropping 23.22% to its lowest level since January 1994. Following a mild winter and expected seasonal demand declines in spring, natural gas storage levels have come down. U.S. capacity to convert to liquified natural gas (LNG) picked up with the resumption of shipments from the Freeport LNG export plant in February. Four more LNG plants were expected to be built to meet European demand. However, increased borrowing costs and lower gas prices were cited as reasons for halting two of those plants.

Within agriculture, the S&P GSCI Sugar rallied 11.32% in March, hitting a five-year high as India cut exports after rain damage to their sugar crop. The S&P GSCI Sugar has been the “sweetest” or best-performing constituent of the 24 commodities comprising the headline S&P GSCI in 2023, up 20.27% YTD and 27.63% year-over-year.

1 Home, Andy. “The return of the London Metal Exchange’s nickel curse.” Reuters. March 21, 2023.

The posts on this blog are opinions, not advice. Please read our Disclaimers.

Minor Impact to Headline S&P/ASX Indices from GICS Changes

Contributor Image
Sean Freer

Director, Global Equity Indices

S&P Dow Jones Indices

Revisions to the Global Industry Classification Standard (GICS®) structure were implemented at the March S&P/ASX rebalance. The changes affect the GICS structure at all levels and involve a number of intra- and inter-sector changes for companies within the S&P/ASX 200 and S&P/ASX 300.

Inter-sector changes are the reclassification of constituents to a different sector under the new GICS structure, while intra-sector changes refer to firms being reclassified (i.e., sub-industry updates) within their current sector.

Inter-Sector Changes

All of the companies within the S&P/ASX 200 and S&P/ASX 300 that will change sector are part of the discontinued Data Processing & Outsourced Services sub-industry within the Information Technology sector. Companies within this sub-industry will either be reclassified to the new Transaction & Payment Processing Services sub-industry within the Financials sector or moved to the Industrials sector under the new Data Processing & Outsourced Services sub-industry.

This change has resulted in five companies within the S&P/ASX 300 changing sector, with three of those companies being constituents of the S&P/ASX 200. Collectively, these companies make up less than 0.90% of weight in each index.

Intra-Sector Changes

GICS changes that were implemented in the Consumer Discretionary sector redefined sub-industries based on the nature of goods sold. The discontinuation of the Internet & Direct Marketing Retail Subindustry, as well as the merger of General Merchandise Stores and Department Stores into a new sub-industry called Broadline Retail, account for several reclassifications.

The Real Estate sector was affected by an increased granularity of company classifications within real estate investment trusts (REITs). In particular, self-storage, data centers, telecom towers and timber REITs were given their own categories, while further granularity was also added to residential REITs.

Meanwhile in the Financials sector, the Thrifts & Mortgage Finance sub-industry (within the Banks industry group) has been discontinued. Mortgage finance companies mainly offer mortgage finance-related products & services and generates fee-based revenue, distinct from banks. These companies will move into the Financial Services industry group as a new sub-industry—Commercial & Residential Mortgage Finance.

Another change worth noting is that the Trucking sub-industry within Transportation was discontinued, with new sub-industries Ground Transportation and Passenger Ground Transportation being created.

In total, there are 13 companies within the S&P/ASX 300 and seven within the S&P/ASX 200 that were reclassified into a different sub-industry, amounting to a collective index weight of 3.22% and 3.16%, respectively.

The posts on this blog are opinions, not advice. Please read our Disclaimers.