Get Indexology® Blog updates via email.

In This List

First Islamic Indices Based on S&P/ASX Series Launched

SPIVA U.S. Scorecard 2022: Fewer Excuses

International Women’s Day Embraces Equity

S&P U.S. Indices Year-End 2022: Analyzing Relative Returns to Russell

Commodities Could Not Escape the Sea of Red Seen Across Asset Classes in February

First Islamic Indices Based on S&P/ASX Series Launched

Contributor Image
Eduardo Olazabal

Associate Director, Global Exchange Indices

S&P Dow Jones Indices

S&P DJI is launching its first S&P/ASX Shariah Indices, which aim to track the performance of Shariah-compliant stocks in the S&P/ASX 200 and the S&P/ASX 300. This launch comes in the context of increased interest in the Muslim community for Shariah investing in Australia.

The Muslim community in Australia accounts for 3.2% of the population, or over 800,000 people as of 2021,1 and has grown at around 5.5% per year over the past 20 years. This expanding segment of the population may need specialized financial services catering to their preferences.

Shariah-compliant investing has grown considerably in recent years, as interest expands outside traditional Islamic markets. By the end of 2022, there were 27 Islamic equity exchange traded funds (ETFs) worldwide, accounting for over USD 1.6 billion in AUM. This was up from USD 347 million AUM in 2017, making Islamic ETFs one of the fastest-growing ETF categories, with a 37% annual growth rate.2

S&P DJI has been the leading Islamic index provider since the launch of the world’s first Islamic benchmarks in 1999. Now with the launch of the S&P/ASX 200 Shariah and S&P/ASX 300 Shariah, the widely used S&P/ASX Indices join some of the world’s most recognized equity benchmarks already with a Shariah-compliant version, such as the S&P 500® Shariah, the S&P/TOPIX 150 Shariah and the S&P/TSX 60 Shariah, to name a few.3

Islamic Indices

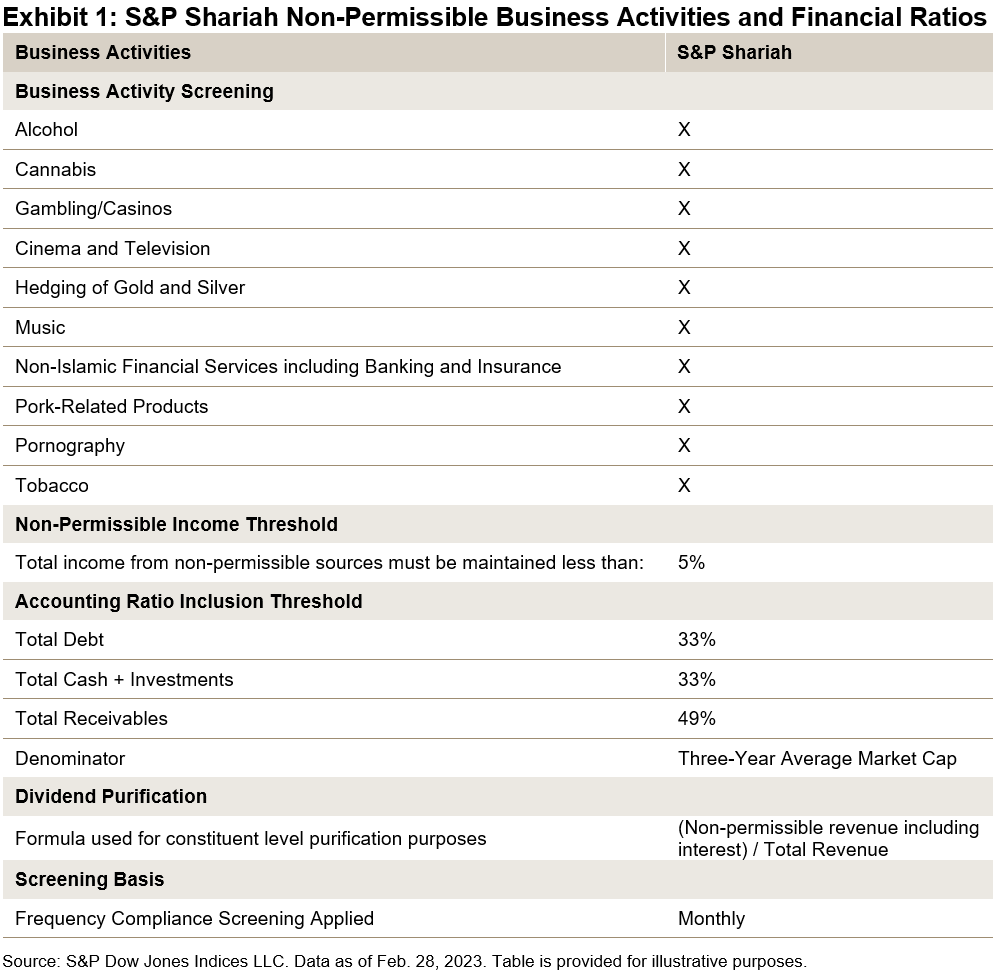
Compliant indices cater to the Islamic market by limiting inclusion to companies that pass rules-based Shariah screening. The criteria are defined by a board of Islamic scholars and consist of two main components: business activities and financial ratios (see Exhibit 1).4

Key Characteristics of the S&P/ASX 200 Shariah and S&P/ASX 300 Shariah

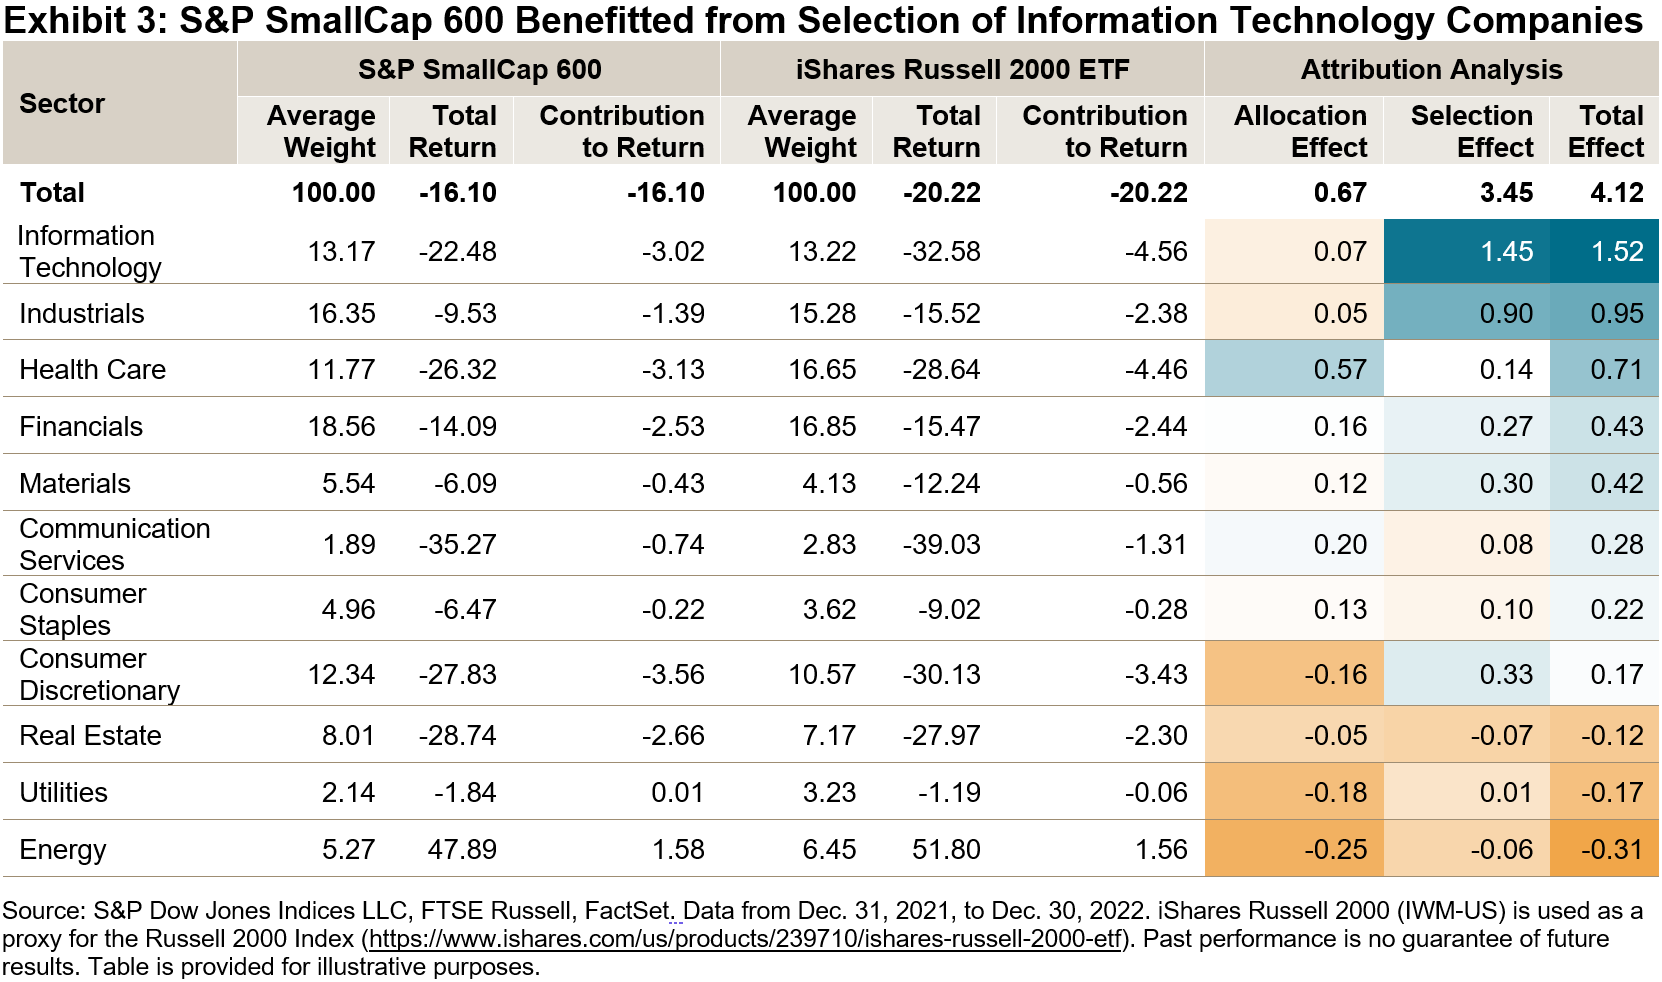
These new indices are derived from the S&P/ASX 200 and S&P/ASX 300, Australia’s preeminent equity benchmarks, and are screened for Shariah compliance according to the criteria mentioned above. The resulting Shariah-compliant indices have distinct sector and stock compositions that drive the indices’ risk and return characteristics as shown in Exhibits 2 and 3.

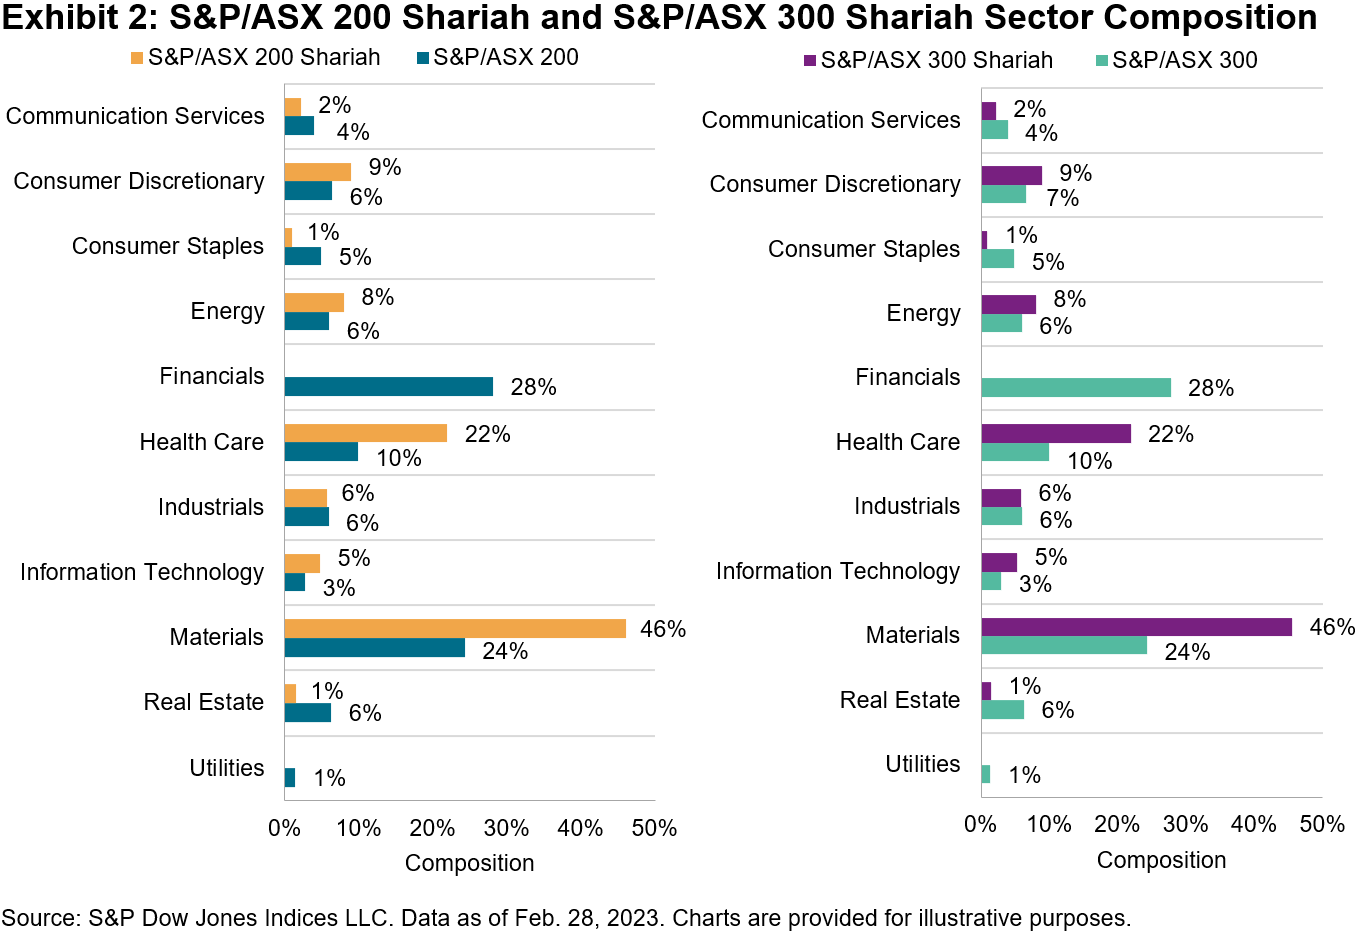
The absence of the Financials sector due to the business activity screen is the most notable difference between the benchmark index and its Shariah-compliant version. This results in a substantial increase in Materials and Health Care weight in the Shariah indices.

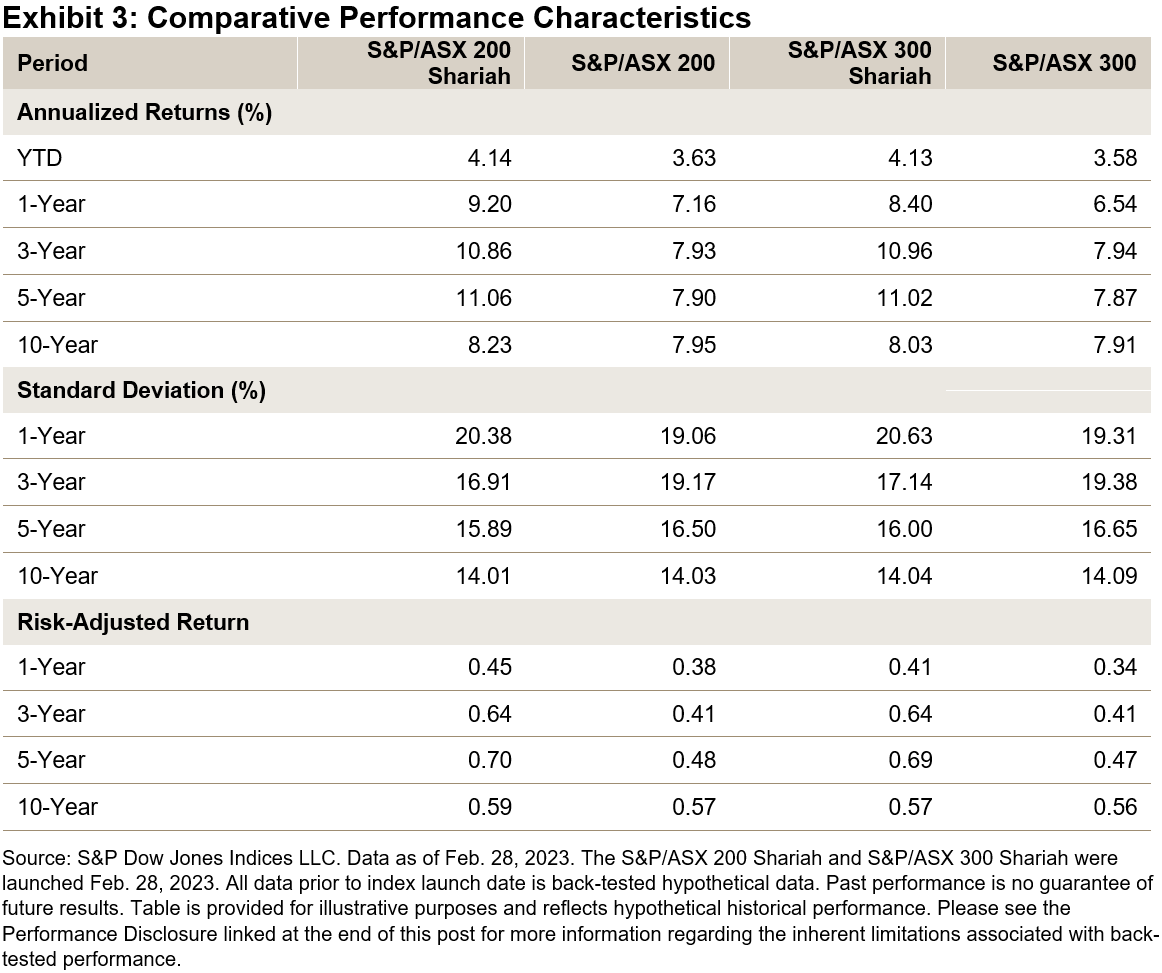
While there may be short term risk and return deviations between Shariah-compliant indices and their conventional counterparts, over the long term, these have shown similar risk and return characteristics, as shown in Exhibit 3.

The S&P/ASX Shariah Indices can be used as performance benchmarks for Shariah-compliant investment strategies, the selection universe for actively managed funds and the basis for index-linked products such as ETFs, index mutual funds and structured products. It is also important to note that customization is available to accommodate various preferences or requirements around sector or stock concentration.

1   Source: Australian Bureau of Statistics. Religious affiliation in Australia in 2021.

2   Source: Data from Morningstar as of Dec. 31, 2022. For more information on recent market developments in the Islamic indices space, please refer to the following: The Growth of Islamic Index-Based Strategies.

3   For more information on the performance of the full suite of S&P DJI’s Islamic indices, please refer to the quarterly S&P Shariah Index Scorecard. S&P/ASX Shariah Indices can be found in the Q1 2023 update.

4   For more details on the construction and maintenance of S&P Shariah Indices, please refer to the S&P Shariah Indices Methodology.

The posts on this blog are opinions, not advice. Please read our Disclaimers.

SPIVA U.S. Scorecard 2022: Fewer Excuses

Contributor Image
Tim Edwards

Managing Director, Index Investment Strategy

S&P Dow Jones Indices

For over a decade, our SPIVA® Scorecards have shown a majority of actively managed U.S. large-cap equity funds underperforming the S&P 500®. According to the freshly published SPIVA U.S. Year-End 2022 Scorecard, the annual underperformance rate dropped to the slimmest of margins last year: just 51% of large-cap U.S. managers lagged the S&P 500 in 2022.

Two key market trends associated with active performance provide context for this figure. One, explored by Anu Ganti in an earlier blog, was a sharp relative increase in the opportunity for outperformance across a range of global equity markets. Another, specific to large-cap U.S. equities, was a reversal in the trend of strong performance of the largest stocks.

The latter point matters because one of the virtues often claimed for active management is its avoidance of perceived overconcentration in the largest stocks in the benchmark. Accordingly, active equity funds frequently underweight the index’s largest stocks (or at least some of them); if the largest companies outperform, then active funds are more likely to lag and, compounding the issue, the weight of the largest names will have also increased—so that the active funds will, all else equal, be even more underweight. Thus, as and if the largest stocks continue to outperform, active funds might underperform in ever-increasing degrees.

This is exactly what seems to have happened between 2013 and 2021. In the summer of 2013, the largest five companies in the S&P 500 accounted for roughly 11% of the index’s weight. As Exhibit 1 shows, this concentration more than doubled to over 23% by December 2021; not coincidentally, our SPIVA U.S. Year-End 2021 Scorecard reported a one-year underperformance rate of 85% for actively managed large-cap U.S. equity funds—close to a record high for any year of the scorecard’s 20-year history.

However, as can also be seen in Exhibit 1, concentration began to diminish in 2022. Previous market darlings, including Facebook, Amazon, Alphabet, Microsoft, Tesla and Apple, to name a few, underperformed materially. Meanwhile, as the U.S. dollar strengthened, smaller and more domestically oriented names were judged to have better prospects, while previously unfancied companies in the Materials and Energy sectors benefited from a steep rise in commodity prices. Exhibit 2 summarizes the changes in fortune that swept through markets last year, comparing the annualized excess returns (versus the S&P 500) for a range of large-cap indices in two periods: December 2013 to December 2021, and over the full-year 2022.

Will such tailwinds for active managers continue into 2023 and beyond? It is certainly possible. But it is also worth emphasizing that, even now, there is still plenty of ground for active managers to make up if they hope to change the long-term statistics; according to the year-end 2022 scorecard, 91% and 95% of all actively managed large-cap U.S. equity funds underperformed the S&P 500 over 10 years and 20 years, respectively.

If an underperformance rate close to a coin-flip is taken to be a “good” year for active managers, then 2022 was a “good” year. But there were also fewer excuses for underperformance, and the long-term record suggests that the swallow of 2022 performance does not an active summer make.


The posts on this blog are opinions, not advice. Please read our Disclaimers.

International Women’s Day Embraces Equity

Contributor Image
Barbara Velado

Senior Analyst, Research & Design, Sustainability Indices

S&P Dow Jones Indices

March 8th marks International Women’s Day, an event that honors and celebrates women worldwide and that has been observed for over a century. This year’s theme is Embracing Equity, and it highlights the fundamental difference between equality and equity. While these words are often used interchangeably, the former means giving everyone equal opportunities, while the latter recognizes specific circumstances when allocating resources to achieve equal outcomes. But how close are companies to attaining true gender parity?

The Road to Gender Balance

Not only is there an ethical case for gender parity, but also an economic one: enhanced female representation in the workplace could add USD 12 trillion to global GDP.1 Studies show the added benefits of corporate gender diversity, from entry-level to senior positions, leading to productivity and innovation gains.2 Regulation proposals aimed at increasing gender balance are growing, with the EU adopting minimum targets for corporate boards.3 Despite the progress, the road to gender balance is a long one—the World Economic Forum (WEF) estimates that it will take 132 years to close the gender gap.4

We explore the share of women in the workforce across regional indices, within management positions and at the board level, as well as the total number of women employed across all functions5 (see Exhibit 1). The U.K. is the only region where women cross the 40% threshold for board membership and across total workforce, with Europe and the U.S. closely following. Within the S&P 500®, women represent 39% of total workforce roles and close to 33% of board appointments.

While weighted averages are helpful, they might not paint the full picture. We examine the distribution of female representation across three functions within the S&P 500. Management and board positions’ frequency distribution tends to be centered around lower percentages of women appointments (see Exhibit 2).

Looking at the S&P 500 from a sectoral perspective, Health Care and Financials lead the charts, with women representing at least 50% of total workforce, having reached gender parity (see Exhibit 3). Conversely, Materials and Energy are the least gender-diverse sectors. It is worth noting the sectoral dispersion between total workforce and boards’ women composition. The difference between most and least diverse sectors for board membership is 7.6%, while for total workforce is 31%.

Retaining Women Talent

Not only are women still underrepresented across most corporate ladder levels, they are also leaving companies at an alarming rate relative to their male counterparts.6 Talent retention is increasingly important for women’s career advancement. Employee support programs, such as paid parental leave, flexible working and hybrid arrangements, can be highly beneficial. More than 45% of companies within the S&P 500 adopt flexible working and 40% have paid maternity leave (more than legally required), but only 32% offer paid non-primary parental leave (see Exhibit 4).

Going beyond equal opportunities and creating equal outcomes requires recognizing heterogeneity of women’s characteristics and circumstances, in order to remove systemic barriers that hinder long-term success. Data from the S&P Global Corporate Sustainability Assessment (CSA)7 suggests that workplace gender gaps persist across regions, sectors and managerial positions. There is more to do to bring and retain women in the workplace and empower them to attain their full potential. The benefits of doing so are vast and contribute to the UN’s Sustainable Development Goals’ agenda on Gender Equality.

1 McKinsey Global Institute gender report.

2  Harvard Business Review Research 2019.

3 European Commission announcement.

4  WEF Global Gender Gap Report 2022.

5  Management positions span junior, middle and senior management roles. Datapoints included in analysis have at least 80% coverage by weight.

6 Women in the Workplace Report 2022 within corporate America

7 More information on CSA here.

The posts on this blog are opinions, not advice. Please read our Disclaimers.

S&P U.S. Indices Year-End 2022: Analyzing Relative Returns to Russell

Contributor Image
Fei Wang

Senior Analyst, U.S. Equity Indices

S&P Dow Jones Indices

2022 was a challenging year across asset classes, including equities. Exhibit 1 shows that there were declines across the U.S. equities market cap spectrum. For example, the S&P 500® fell 18% for the whole year; the gains in the fourth quarter were not sufficient to overcome the declines during the first three quarters.

Amid the turbulent environment, S&P DJI’s U.S. equity indices fared well relative to their Russell counterparts, generally outperforming in most months over the past year. For instance, the S&P 500 outperformed the Russell Top 200 by 1.7% in 2022, its largest margin since 2011. The S&P SmallCap 600® outperformed the Russell 2000 by 4.3%, far above its average annual outperformance since 1995 (1.7%), and the S&P 900 and S&P Composite 1500® outperformed their Russell counterparts by 1.3% and 1.4%, respectively, both the third-highest margins since 1996.

Information Technology exposure was a key reason for the outperformance of S&P DJI’s indices last year. Exhibit 3 shows that the choice of Information Technology companies (selection effect) accounted for over 80% of the overall S&P SmallCap 600 outperformance against the Russell 2000. Other major S&P DJI’s indices tell a similar story: S&P DJI’s U.S. equity indices benefited from less exposure to, and better selection in, the Information Technology sector in 2022.

The outperformance from S&P U.S. Core Indices helped S&P Style Indices’ relative returns (see Exhibit 4). Most notably, the S&P MidCap 400 Growth outperformed Russell MidCap Growth by 7.8%, the largest margin since 2003. The S&P MidCap 400 Value outperformed Russell MidCap Value by 5.1%, the third-highest margin since 1996.

More broadly, Exhibit 5 shows how the frequency of outperformance by the S&P Style Indices generally increased with the frequency of outperformance by the S&P Core Indices. The frequency of outperformance is based on annual total returns of the S&P DJI indices and their Russell counterparts since 1996. The blue bars represent benchmark indices, while the other two colors represent S&P DJI’s outperformance conditional on the benchmark outperformance of respective style indices. For example, the S&P MidCap 400 outperformed the Russell MidCap index in 51.9% of years between 1996 and 2022. And in years when the S&P MidCap 400 outperformed, the S&P MidCap 400 Growth always outperformed the Russell MidCap Growth.

The past year was an extremely challenging time for the U.S. equity market, but the S&P Core and Style Indices generally outperformed their Russell counterparts. Once again, such differences in return highlight the potential impact of differences in index construction and how different index characteristics can impact relative returns.

The posts on this blog are opinions, not advice. Please read our Disclaimers.

Commodities Could Not Escape the Sea of Red Seen Across Asset Classes in February

Contributor Image
Jim Wiederhold

Former Director, Commodities and Real Assets

S&P Dow Jones Indices

The S&P GSCI, the world’s leading commodities benchmark, could not escape the volatile markets experienced in February, as the index fell 3.83% for the month. Despite recent declines, inflation remained high, which kept the U.S. Fed steadfast in its rate-hiking campaign, and expectations for a possible easing by year-end 2023 were squashed in the latest Fed commentary. A strong retracement higher of the U.S. dollar from the weakness seen in January put pressure on all major commodities, which are priced in U.S. dollars globally.

Within the petroleum complex, S&P GSCI Heating Oil took the biggest hit, down 9.33% after a flat January. Warmer-than-expected weather in the U.S. played a role in decreasing demand for the crude oil byproduct. Crude oil supply was ample, with no change in OPEC’s production announced and record volumes of crude exports to China and India from Russia’s Pacific terminals. Russian crude exports to northern European countries ceased after EU sanctions took effect on Feb. 5.

The S&P GSCI Industrial Metals fell 7.82% in February with broad weakness across all metals. Despite China’s easing of COVID-19 restrictions, demand from the world’s leading importer of industrial metals has not recovered yet. China’s latest forward-looking Manufacturing PMI reading showed the fastest growth in a decade, however. The S&P GSCI Nickel fell the most among the industrial metals, down 18.27%. The International Nickel Study Group announced that in 2022, the global nickel market flipped from a deficit to a surplus for one of the key metallic inputs to electric vehicles. The London Metal Exchange’s nickel contract is still in question after last year’s spike in prices, leading other exchanges like the CME to announce in February that they would launch an alternative nickel contract by the end of March.

The S&P GSCI Gold gave back all of its gains from January, ending February with a flat YTD performance. The S&P GSCI Silver fell 12.06% in sympathy with gold. Silver prices tend to be much more volatile than gold, to the downside as well as the upside. The pressure from the industrial metals space was also felt with silver’s global demand making up about 50% of its use.

Within agriculture, S&P GSCI Wheat prices fell the most, down 8.20% YTD. According to S&P Global Commodities Insights, global wheat prices are expected to see further declines due to the likely rise in supplies across producer countries such as Australia, Canada and Russia. After a year of tightened supplies from the start of the Russia-Ukraine conflict, supplies are likely to normalize.

The S&P GSCI Livestock rose 1.29% and was the only sector to end the month in positive territory, with feeder cattle and live cattle leading the way. Cattle prices have risen steadily since their low in May 2022 due to a progressively smaller global herd and global demand remaining strong.

The posts on this blog are opinions, not advice. Please read our Disclaimers.