Get Indexology® Blog updates via email.

In This List

Active Ability versus Active Outperformance

Digging Into Digital Assets

Exploring the Defensive Advantage

Why Indexing Can Be Applied to Thematics

A Selective Approach to Style: The S&P Pure Growth and Value Indices

Active Ability versus Active Outperformance

Contributor Image
Anu Ganti

U.S. Head of Index Investment Strategy

S&P Dow Jones Indices

Some commentators have argued that today’s market environment—characterized by rising rates and economic growth concerns—is a ripe environment for stock pickers.

This argument is conditionally correct, as long as we remember that having the opportunity to add value does not guarantee that value gets added. In today’s environment, active managers have good potential to add value. Dispersion and correlation provide an analytic context:

  • Active managers should prefer above-average dispersion because stock selection skill is worth more when dispersion is high.
  • The role of correlation is more nuanced. When correlations are high, the benefit of diversification falls. Therefore, managers should prefer above-average correlations because they reduce the opportunity cost of a concentrated portfolio.

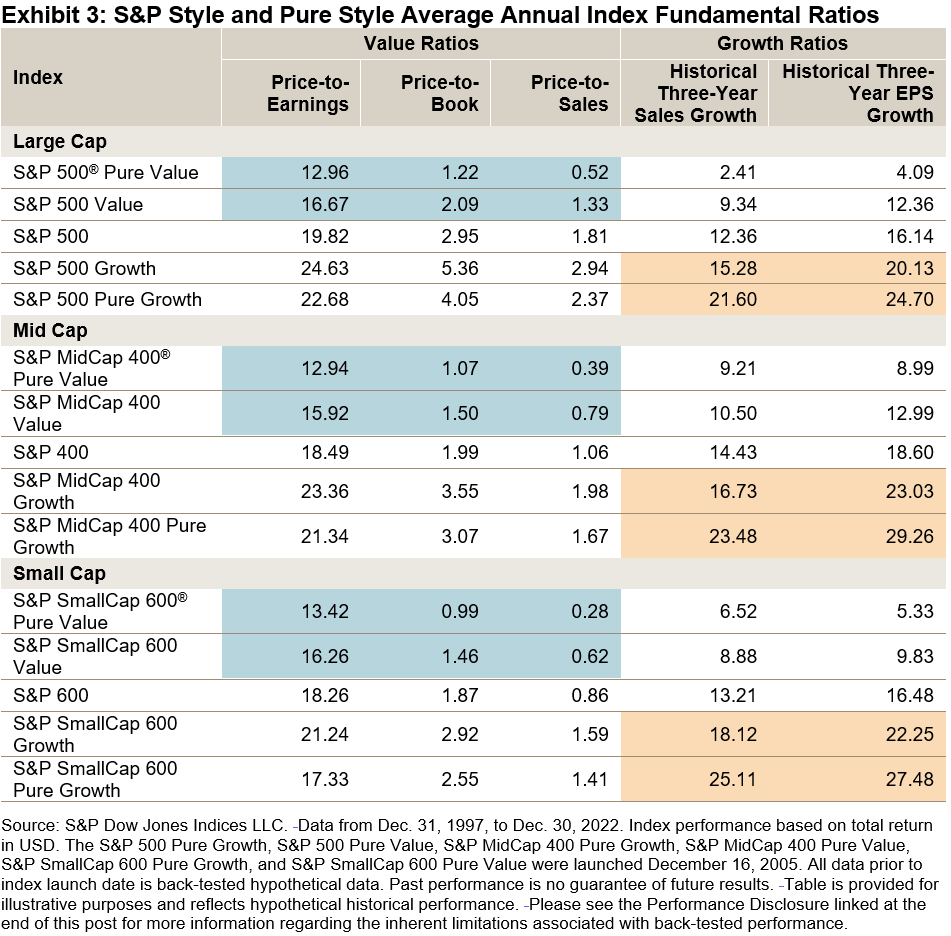
In Exhibit 1, we observe that the 12-month average dispersion of the S&P 500® has widened since 2014, while correlations have been relatively high. Higher dispersion also offers greater opportunities for active rotational strategies among countries, sectors and factors. In January 2023, we saw the highest spread between the best and worst equity factor indices since February 2021.

Active managers typically assume incremental volatility in the hope of earning incremental returns. How high must those returns be to justify the additional volatility active managers take on? The cost of concentration helps answer this question. When correlations are low, concentrated active managers incur substantially more volatility than diversified index funds. A higher cost of concentration implies a larger foregone diversification benefit, translating into a higher hurdle for active managers to overcome.

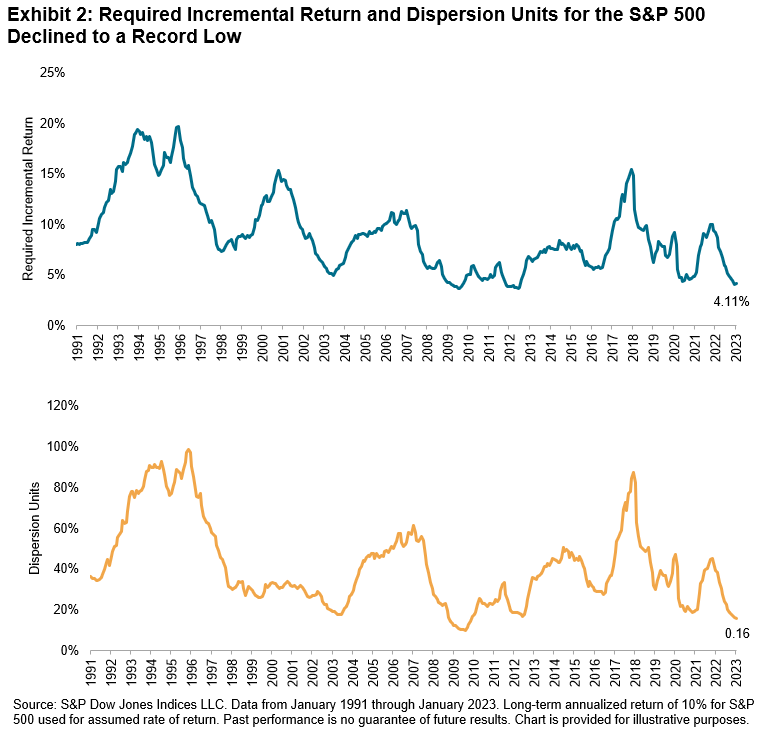
Multiplying the cost of concentration by a rate of return consistent with the market’s historical performance, we arrive at the required incremental return shown in the top half of Exhibit 2 for the S&P 500. Driven by the higher correlations seen in Exhibit 1, this measure declined by almost half in the last 12 months, to levels not seen since mid-2012, indicating that active managers gave up a much smaller diversification benefit in 2022 compared to 2021.

The bottom half of Exhibit 2 divides the required incremental return by dispersion to translate the measure into dispersion units. We can interpret a lower number of dispersion units to mean easier conditions for active management. As both dispersion and correlations were generally higher in 2022, we observe a relatively auspicious environment for active management.

While favorable conditions do not guarantee favorable active results, last year’s relatively fortuitous conditions for stock selection may have aided manager outperformance. Just 51% of large-cap active managers lagged the S&P 500 in the first half of 2022, compared to 85% in 2021. When SPIVA® results for year-end 2022 become available, it would not be surprising to see U.S. large-cap equity funds post their lowest underperformance rate since 2009.

The posts on this blog are opinions, not advice. Please read our Disclaimers.

Digging Into Digital Assets

How does indexing work for cryptocurrency and digital assets? S&P DJI’s Sharon Liebowitz discusses how indices are bringing transparency to digital assets, key components of index design, and potential use cases for index-based crypto strategies.

The posts on this blog are opinions, not advice. Please read our Disclaimers.

Exploring the Defensive Advantage

Take a closer look at the participation and protection characteristics of sector and defensive factor indices with S&P DJI’s Craig Lazzara and Anu Ganti.

The posts on this blog are opinions, not advice. Please read our Disclaimers.

Why Indexing Can Be Applied to Thematics

Contributor Image
Anu Ganti

U.S. Head of Index Investment Strategy

S&P Dow Jones Indices

Index funds, which hardly existed 50 years ago, now play a prominent role in global financial markets. But passive investing does not dominate in every market segment. Recently, we have seen exponential growth in so-called “thematic” investing, with a proliferation of themes in areas like cybersecurity, robotics and electric vehicles. This more granular space is sometimes perceived to offer greater opportunities for active stock selection, as opposed to an index-based approach.

In traditional categories, passive investors have benefited substantially by saving on fees and avoiding active underperformance. Our recently released paper, The Case for Indexing Thematics with the S&P Kensho New Economies, shows that very similar principles may apply to the thematics space.

In the case of broad equity markets, one important cause of the difficulty in outperforming through the selection of single stock “picks” is that in most markets, the distribution of single stock returns is positively skewed, with the result that only a minority of constituent stocks outperform the index, particularly as the time horizon extends. The universe of stocks defined by the S&P Kensho New Economies Composite Index proves to be no exception. Exhibit 1 plots the distribution of cumulative returns of the index constituents over the past four years: the median return of -9.7% is far less than the average of 17.3% and, during the period, only 37% of stocks outperformed the index.

This highlights the difficulty for thematic active managers seeking to outperform with concentrated portfolios, because when faced with a distribution of returns that is positively skewed (like in Exhibit 1), holding more stocks increases the likelihood of outperformance. The problem is of particular concern in the thematics space because, given the inherently granular nature of certain themes, the challenge of avoiding undue concentration is especially germane. For example, there are only 31 constituents within the S&P Kensho Robotics Index, one of the 25 subsectors that make up the 559 constituents within the S&P Kensho New Economies Composite Index (as of Dec. 30, 2022). In addition to being diversified across themes, the composite index’s concentration is further mitigated by a modified equal-weight approach applied in the construction of each subsector. The result of all of which is an index that is less concentrated than would be the case if a simple market-cap weighting scheme were followed.

Exhibit 2 illustrates the relative difference in concentration levels observed in the S&P Kensho New Economies Composite Index, its market-cap-weighted equivalent, and the average of the 20 largest actively managed thematic funds. We use a simple measure of concentration, namely the aggregate weight of the 10 largest constituents, because it is freely available for the active funds; interested readers can find further analysis of index concentration in our paper.

The largest active funds appear, on average, much more concentrated that the S&P Kensho New Economies Composite Index, with on average 35% of their portfolios’ weight in the top 10 holdings, compared to only 10% for the index. Meanwhile, if the composite index was capitalization weighted, its concentration levels would have been even higher, with 43% of its weight in the top 10 holdings.

Considerations such as these help explain why thematic investing may be ripe for “indicization,” in which the well-known benefits of passive investing might be captured through benchmarks such as those in the S&P Kensho New Economies.  In short, thematics appears to be yet one more segment of the investment landscape where, to put it simply: indexing works.

The posts on this blog are opinions, not advice. Please read our Disclaimers.

A Selective Approach to Style: The S&P Pure Growth and Value Indices

Contributor Image
Cristopher Anguiano

Senior Analyst, U.S. Equity Indices

S&P Dow Jones Indices

S&P Dow Jones Indices (S&P DJI) offers style and pure style indices, which categorize companies based on their growth and value characteristics. We recently published the paper Comparing S&P Style & Pure Style Indices, where we highlighted differences in design, fundamentals and potential applications for both index series.

Exhibit 1 summarizes the index construction of the two series. S&P Style Indices provide broad style exposure, covering all stocks in the benchmark universe and dividing the benchmark weight into roughly equal portions at each annual reconstitution. S&P Pure Style Indices have a more selective focus and weight companies by their style scores, rather than in proportion to their float market capitalization. Both series use the same six factors to define growth and value.

Differences in index construction help to explain the different constituent counts in the two types of indices. For example, Exhibit 2 shows that companies can be found in both growth and value indices, whereas there is no overlap between the pure growth and pure value indices. The pure style baskets also contain fewer constituents than their style counterparts, reflecting a more selective approach to style exposures.

The selective focus of pure style indices means that S&P Pure Value and Pure Growth Indices reflect stronger value and growth characteristics than their style counterparts. Exhibit 3 shows this by comparing the average annual fundamental ratios of various indices: pure value indices typically had lower price-to-earnings, price-to-book and price-to-sales ratios, while pure growth indices had higher three-year sales growth and three-year EPS growth rates.

Unsurprisingly, perhaps, Exhibit 4 shows that S&P Pure Style Indices typically outperformed their S&P Style Index counterparts in months when their style was in favor. Based on data since 1997, Exhibit 4 shows that S&P Pure Style Indices posted higher average monthly total returns than S&P Style Indices when their style outperformed.

Lastly, we compare how actively managed funds have fared against the S&P Style and Pure Style Indices. Exhibit 5 compiles historical data of the percentage of actively managed style funds that underperformed both index series. Even though some active managers had success in shorter time periods, the S&P Style and S&P Pure Style Indices were difficult to beat over long-term horizons.

In conclusion, differences in design and objectives between the S&P Style and S&P Pure Style Indices allow investors to express style exposures in different ways: a broad and exhaustive approach for S&P Style Indices, or a narrower and selective approach for S&P Pure Style Indices. While the S&P Pure Style Indices can be used as suitable benchmarks for actively managed style portfolios, historical results show the potential benefit of taking an index-based approach.

The posts on this blog are opinions, not advice. Please read our Disclaimers.