Get Indexology® Blog updates via email.

In This List

Why Indexing Can Be Applied to Thematics

A Selective Approach to Style: The S&P Pure Growth and Value Indices

Balancing the Scales in U.K. Equity with the S&P 500

Good Things Come in Threes: Muni Bonds Appear Ripe for 2023

Record CDS Index Volumes As We Head into the 20-Year Anniversary of iTraxx and CDX

Why Indexing Can Be Applied to Thematics

Contributor Image
Anu Ganti

U.S. Head of Index Investment Strategy

S&P Dow Jones Indices

Index funds, which hardly existed 50 years ago, now play a prominent role in global financial markets. But passive investing does not dominate in every market segment. Recently, we have seen exponential growth in so-called “thematic” investing, with a proliferation of themes in areas like cybersecurity, robotics and electric vehicles. This more granular space is sometimes perceived to offer greater opportunities for active stock selection, as opposed to an index-based approach.

In traditional categories, passive investors have benefited substantially by saving on fees and avoiding active underperformance. Our recently released paper, The Case for Indexing Thematics with the S&P Kensho New Economies, shows that very similar principles may apply to the thematics space.

In the case of broad equity markets, one important cause of the difficulty in outperforming through the selection of single stock “picks” is that in most markets, the distribution of single stock returns is positively skewed, with the result that only a minority of constituent stocks outperform the index, particularly as the time horizon extends. The universe of stocks defined by the S&P Kensho New Economies Composite Index proves to be no exception. Exhibit 1 plots the distribution of cumulative returns of the index constituents over the past four years: the median return of -9.7% is far less than the average of 17.3% and, during the period, only 37% of stocks outperformed the index.

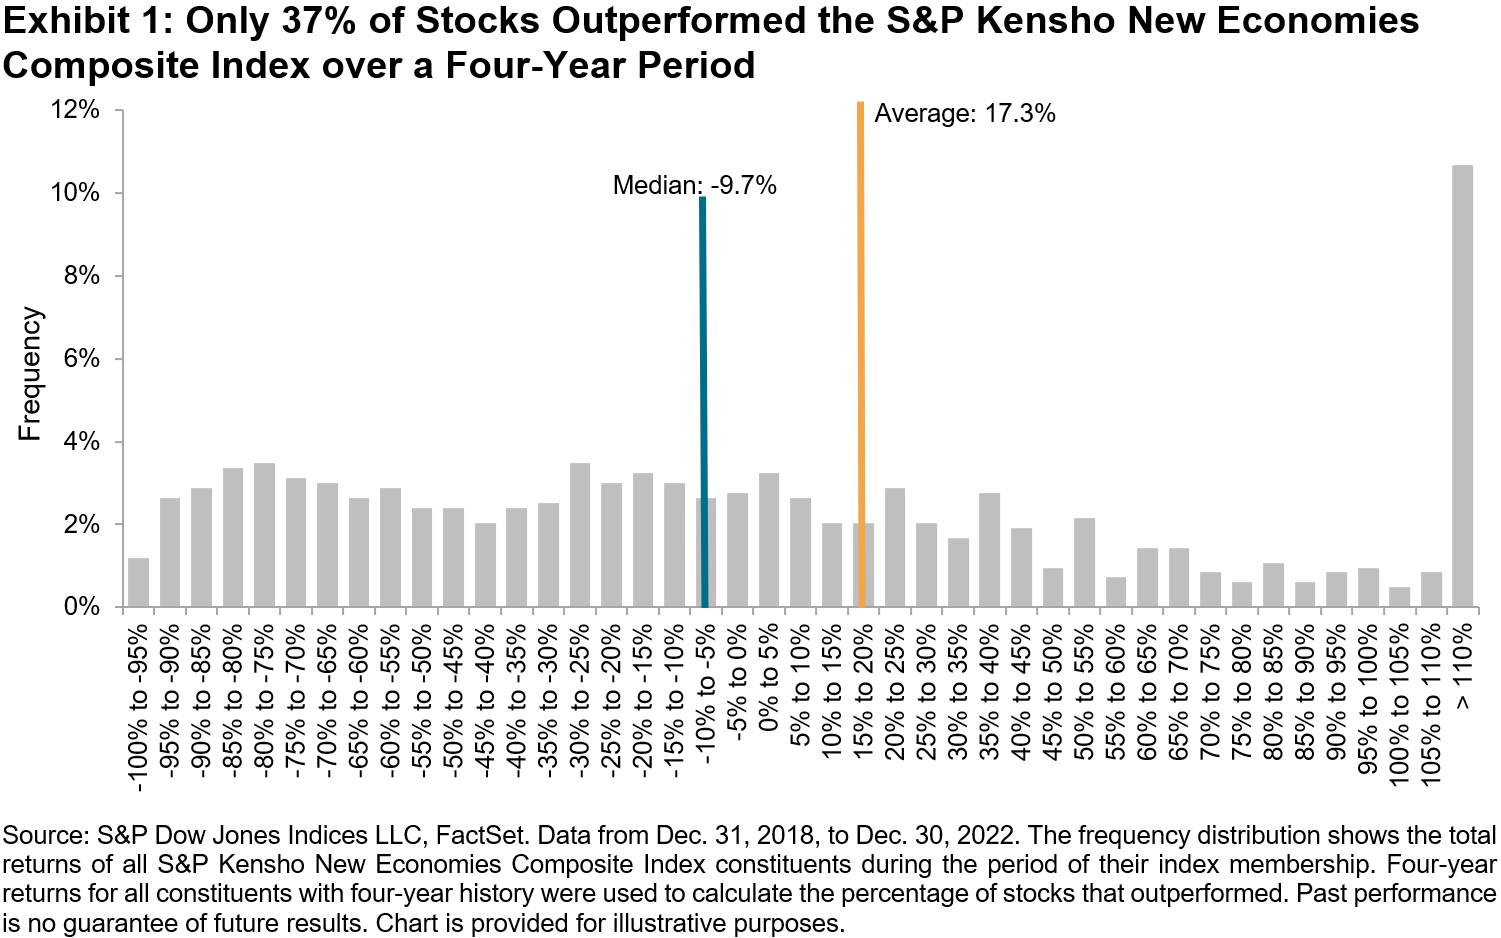
This highlights the difficulty for thematic active managers seeking to outperform with concentrated portfolios, because when faced with a distribution of returns that is positively skewed (like in Exhibit 1), holding more stocks increases the likelihood of outperformance. The problem is of particular concern in the thematics space because, given the inherently granular nature of certain themes, the challenge of avoiding undue concentration is especially germane. For example, there are only 31 constituents within the S&P Kensho Robotics Index, one of the 25 subsectors that make up the 559 constituents within the S&P Kensho New Economies Composite Index (as of Dec. 30, 2022). In addition to being diversified across themes, the composite index’s concentration is further mitigated by a modified equal-weight approach applied in the construction of each subsector. The result of all of which is an index that is less concentrated than would be the case if a simple market-cap weighting scheme were followed.

Exhibit 2 illustrates the relative difference in concentration levels observed in the S&P Kensho New Economies Composite Index, its market-cap-weighted equivalent, and the average of the 20 largest actively managed thematic funds. We use a simple measure of concentration, namely the aggregate weight of the 10 largest constituents, because it is freely available for the active funds; interested readers can find further analysis of index concentration in our paper.

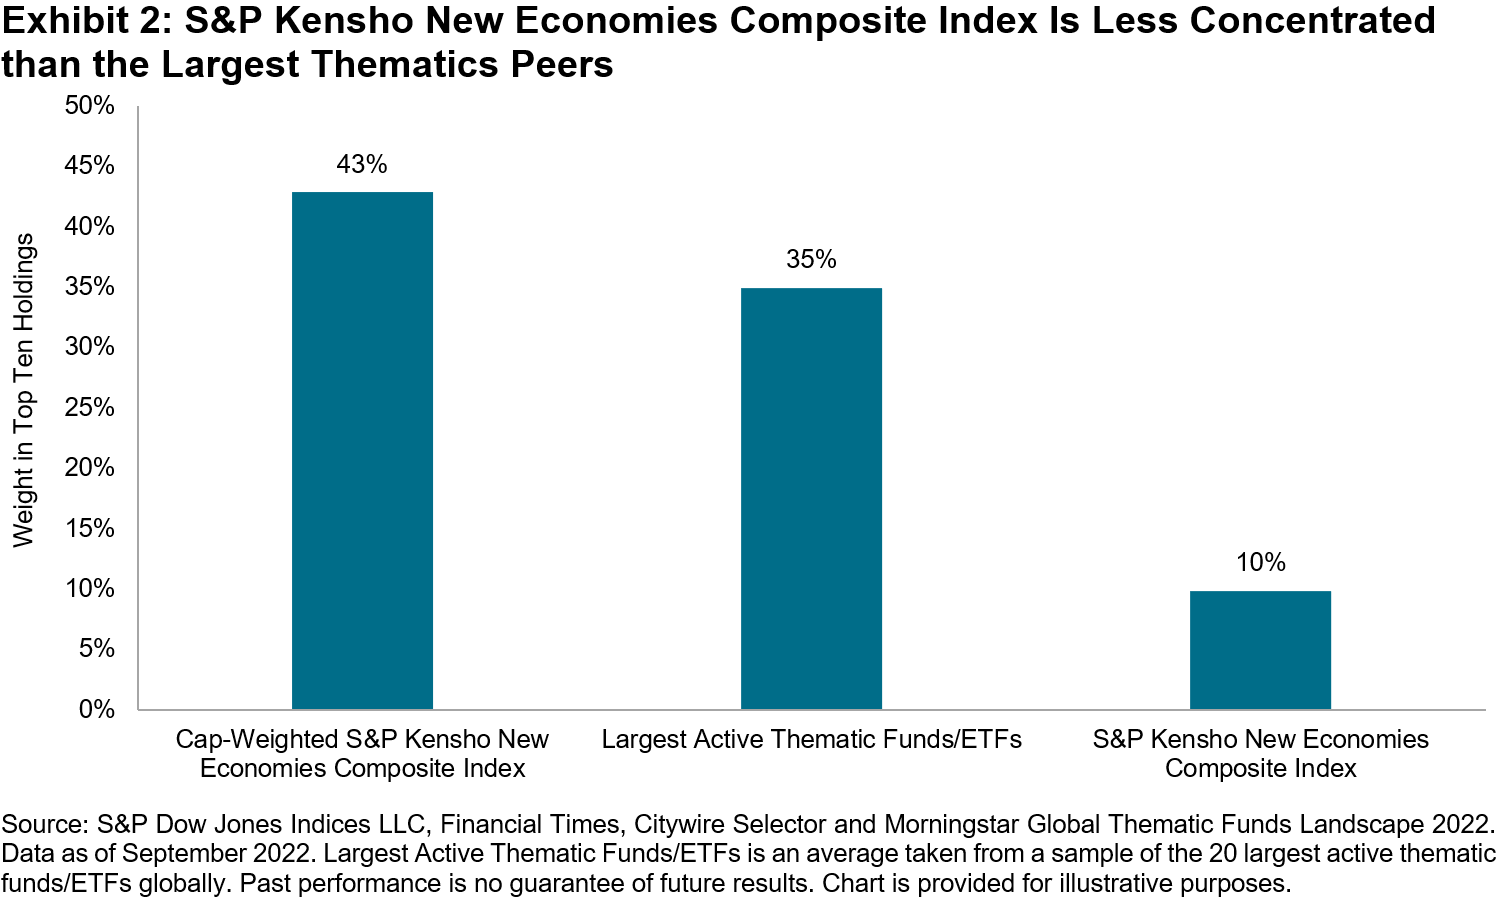
The largest active funds appear, on average, much more concentrated that the S&P Kensho New Economies Composite Index, with on average 35% of their portfolios’ weight in the top 10 holdings, compared to only 10% for the index. Meanwhile, if the composite index was capitalization weighted, its concentration levels would have been even higher, with 43% of its weight in the top 10 holdings.

Considerations such as these help explain why thematic investing may be ripe for “indicization,” in which the well-known benefits of passive investing might be captured through benchmarks such as those in the S&P Kensho New Economies.  In short, thematics appears to be yet one more segment of the investment landscape where, to put it simply: indexing works.

The posts on this blog are opinions, not advice. Please read our Disclaimers.

A Selective Approach to Style: The S&P Pure Growth and Value Indices

Contributor Image
Cristopher Anguiano

Senior Analyst, U.S. Equity Indices

S&P Dow Jones Indices

S&P Dow Jones Indices (S&P DJI) offers style and pure style indices, which categorize companies based on their growth and value characteristics. We recently published the paper Comparing S&P Style & Pure Style Indices, where we highlighted differences in design, fundamentals and potential applications for both index series.

Exhibit 1 summarizes the index construction of the two series. S&P Style Indices provide broad style exposure, covering all stocks in the benchmark universe and dividing the benchmark weight into roughly equal portions at each annual reconstitution. S&P Pure Style Indices have a more selective focus and weight companies by their style scores, rather than in proportion to their float market capitalization. Both series use the same six factors to define growth and value.

Differences in index construction help to explain the different constituent counts in the two types of indices. For example, Exhibit 2 shows that companies can be found in both growth and value indices, whereas there is no overlap between the pure growth and pure value indices. The pure style baskets also contain fewer constituents than their style counterparts, reflecting a more selective approach to style exposures.

The selective focus of pure style indices means that S&P Pure Value and Pure Growth Indices reflect stronger value and growth characteristics than their style counterparts. Exhibit 3 shows this by comparing the average annual fundamental ratios of various indices: pure value indices typically had lower price-to-earnings, price-to-book and price-to-sales ratios, while pure growth indices had higher three-year sales growth and three-year EPS growth rates.

Unsurprisingly, perhaps, Exhibit 4 shows that S&P Pure Style Indices typically outperformed their S&P Style Index counterparts in months when their style was in favor. Based on data since 1997, Exhibit 4 shows that S&P Pure Style Indices posted higher average monthly total returns than S&P Style Indices when their style outperformed.

Lastly, we compare how actively managed funds have fared against the S&P Style and Pure Style Indices. Exhibit 5 compiles historical data of the percentage of actively managed style funds that underperformed both index series. Even though some active managers had success in shorter time periods, the S&P Style and S&P Pure Style Indices were difficult to beat over long-term horizons.

In conclusion, differences in design and objectives between the S&P Style and S&P Pure Style Indices allow investors to express style exposures in different ways: a broad and exhaustive approach for S&P Style Indices, or a narrower and selective approach for S&P Pure Style Indices. While the S&P Pure Style Indices can be used as suitable benchmarks for actively managed style portfolios, historical results show the potential benefit of taking an index-based approach.

The posts on this blog are opinions, not advice. Please read our Disclaimers.

Balancing the Scales in U.K. Equity with the S&P 500

Contributor Image
Sherifa Issifu

Senior Analyst, U.S. Equity Indices

S&P Dow Jones Indices

Our recent paper Why Does the S&P 500® Matter to the U.K.? argues that the S&P 500 presents an opportunity for U.K. investors to diversify their revenue exposure and sector weights across geographies. Since British investors typically suffer from a substantial home bias, such diversification presents an opportunity to improve the risk/return profile of a domestic equity allocation.

Both U.K. companies and U.K. investors are exposed to the same set of domestic macroeconomic conditions. When a large proportion of a company’s revenue is reliant on its domestic customer base and an investor in turn overweights his allocation to U.K. equity, it creates a domestic feedback loop. This means that positive and negative shocks in the U.K. are amplified for a local investor who is not properly diversified.

Moreover, the U.K. has more significant over- and underweights than the S&P 500 relative to a global benchmark. Exhibit 1 compares the sector weights of the S&P 500 and S&P United Kingdom versus the S&P Global 1200. The S&P United Kingdom had larger sector weights than the S&P Global 1200 in Consumer Staples, Energy and Materials, and a far lower weight in Information Technology. On the other hand, the S&P 500 was overweight IT and Communication Services. Hence, incorporating U.S. equities could help a U.K. investor alleviate domestic sector biases by providing exposure to different sectors.

From a performance perspective, U.S. large caps have outperformed their U.K. counterparts most of the time and by a larger magnitude when they do. Over the past 33 calendar years, the S&P 500 has outperformed the S&P United Kingdom two-thirds of the time, as shown in Exhibit 2. In the years when the S&P 500 outperformed it did so by a higher margin on average, at 9.9%, compared to the U.K.’s 8%. This has meant combining the S&P 500 and the S&P United Kingdom (as shown in Exhibit 3) has historically improved the risk/return profile and provided a higher return per unit of risk than a U.K. investment in isolation.

The posts on this blog are opinions, not advice. Please read our Disclaimers.

Good Things Come in Threes: Muni Bonds Appear Ripe for 2023

Contributor Image
Brian Luke

Senior Director, Head of Commodities, Real & Digital Assets

S&P Dow Jones Indices

With one month down in 2023, let’s track the performance of municipal bonds so far: as of Jan. 31, 2023, the yield for the S&P National AMT-Free Municipal Bond Index was at roughly 3% (3.02% to be exact). The total return was up about 3% for January (2.87% to be exact), putting a dent in last year’s sell-off to provide a one-year return of “only” -3% (-2.97%). With rates rising, new opportunities are being uncovered and investors are seeking new ways to access the municipal bond market.

Increasingly, investors are looking for income through index-tracking funds. In January alone, more than USD 25 billion flowed into U.S.-listed fixed income ETFs. While large institutions have traditionally allocated to bonds, retail investors have changed how they allocate to fixed income, with an increasing preference for funds. Focusing on U.S. households, both the share (see Exhibit 1) and total value of assets held in fixed income funds (see Exhibit 2) are larger than individual bond purchases. As a larger percentage of the population enters retirement age, the need for a fixed stream of income would appear to be greater. Federal Reserve data has shown that this has not been the case. Baby Boomers started to enter retirement age in the last decade and are expected to continue through this decade. During that time, U.S. households’ total share of fixed income (both direct bond purchases and purchases through funds) shrank. This contrasts with the equity market, where the total share of equities held has risen from 28% to 35% since 2010.

Over the past five years, individual investors have shown an increasing preference for accessing the bond market through index-tracking ETFs. When comparing fund flows of mutual funds and ETFs, a stark contrast emerged in 2022. Fixed income mutual funds had USD 546 billion in outflows in 2022 due to rising rates and price underperformance. Despite that market backdrop, fixed income ETFs saw USD 199 billion in inflows. This trend also played out in the municipal market. While taxable bond ETF asset flows kept AUM levels relatively flat, municipal bond flows grew by USD 29 billion, pushing municipal bond ETFs assets to over USD 100 billion, a 26% increase

One possible reason for the rising popularity of fixed income ETFs could be investor preference for index-based products with increased transparency and liquidity. Another reason could be the ease of access and low cost. Evidence that retail transaction costs to trade municipal bonds can be as much as 66 bps more than institutional trades provides a good reason for this one-sided flow.1 Transaction costs could potentially be reduced by accessing bonds through mutual funds or ETFs. These ETFs have a distinct advantage in that shares of the fund can be exchanged without the need to incur any transactions in the institutional market.

The current tax equivalent yield on the S&P National AMT-Free Municipal Bond Index is 4.63%. Taking tax benefits into account puts municipal bonds on equal footing with other taxable fixed income sectors like treasuries and corporate bonds. U.S. Treasury yields fall short of that, at 4%, while corporate bonds currently exceed 5% (see Exhibit 3). Those incremental 37 bps do come with credit risk, however, as the average rating for the municipal index is AA, compared with A- for the corporate index.

Rising yields have drawn increased attention to the bond market. As investors readjust to a world where fixed income could actually offer income, they face an unprecedented array of ways to access targeted exposures to states and duration. More than ever before, municipal bond investors are choosing index-based products, making their preferences clear and changing the fund landscape. With hundreds of municipal bond indices tracking the broad market, you can measure the national market, drill down to state-level performance and seek out targeted interest rate exposures down to a single maturity year.

1 Giordano, Jason. “The Hidden Costs of Retail Purchases in Municipal Bonds.” S&P Dow Jones Indices LLC. July 2022.

The posts on this blog are opinions, not advice. Please read our Disclaimers.

Record CDS Index Volumes As We Head into the 20-Year Anniversary of iTraxx and CDX

Contributor Image
Srichandra Masabathula

Associate Director, Fixed Income Products

S&P Dow Jones Indices

This blog was co-authored by Srichandra Masabathula and Nicholas Godec

In 2022, volumes in CDX and iTraxx reached an all-time high of nearly USD 36 trillion—a 43% year-over-year increase. Such record-breaking volumes occurred as we fast approach the 20-year anniversary of the indices—CDX and iTraxx will roll into Series 40 in March and September 2023, respectively. Two decades later, the CDS indices continue to evolve with changing markets and provide the most liquid means for institutional investors to gain or hedge credit exposure. The last three years have been some of the most volatile in recent history—they have also successively set record volumes for CDS indices. When markets were volatile and fixed income liquidity became sparse, the liquidity of the CDS indices remained.

From a notional outstanding perspective, CDS exposure from the iTraxx and CDX indices has continued to climb (see Exhibit 2). Currently, there is over USD 7.5 trillion of notional outstanding in iTraxx and CDX, up from about USD 6.8 trillion at the end of 2021. The magnitude of outstanding notional points to the structural importance of the CDS indices to the global credit markets.

There’s also been a consistent increase in the share of overall CDS exposure that is linked to iTraxx and CDX products. As of year-end 2022, over 70% of all CDS gross notional oustanding was linked to iTraxx and CDX indices, including tranches and swaptions (see Exhibit 3).

At nearly 20 years old, with varied market participants and trillions in volumes and outstanding exposure, one might deem CDX and iTraxx to be mature. However, maturity often connotes the end of growth, which would be incorrect. Rather, the CDS indices are coming of age and continue to grow and change to reflect the needs of the market participants they serve. The indices may be getting older—but they’ve no signs of slowing down.


The posts on this blog are opinions, not advice. Please read our Disclaimers.